Market Insights Snapshot
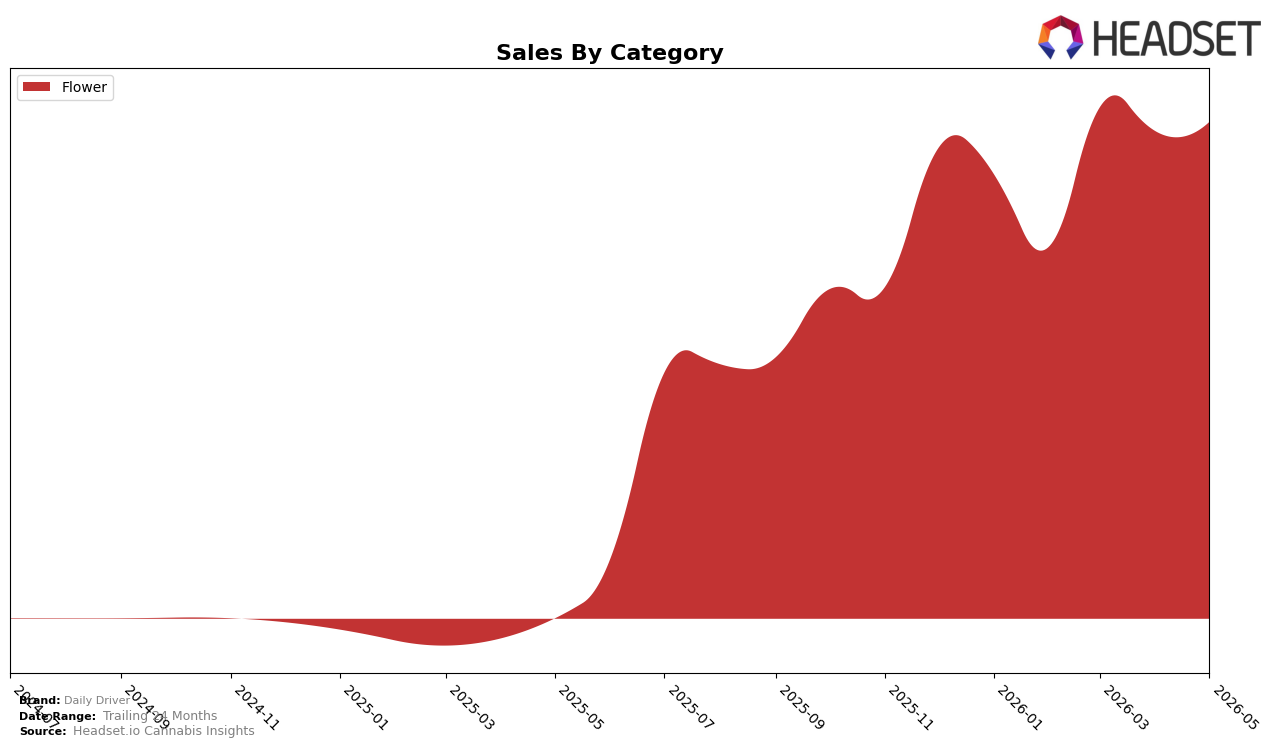
Daily Driver operated as a single-category brand in May 2026, with Flower accounting for 100.0% of sales and an average item price of $34.64. Within Flower, year-over-year sales rose 1,483,605.76% while month-over-month sales increased 1.94%, and the average price climbed 131.30% YoY alongside a MoM sales uptick of 1.94%. In the Missouri Flower ranking context, the brand sat at rank 26 in May 2026, which, paired with a 100.0% category concentration and a 131.30% YoY price lift, implies that recent volume gains are concentrated in a single lane where price expansion has not yet translated into a top-20 position.
The combination of a 100.0% Flower mix and a 1,483,605.76% YoY surge, against only a 1.94% MoM gain, indicates a base-effects spike that is normalizing and suggests that sustaining share growth will require more than price-led momentum. With rank 26 in Missouri Flower and a 131.30% YoY price increase occurring alongside only a 1.94% MoM lift, the pattern implies that Daily Driver’s positioning is currently price-accepting but not rank-advancing, pointing to a need for distribution breadth or form-factor expansion to convert prior YoY acceleration into persistent rank improvement.
Competitive Landscape
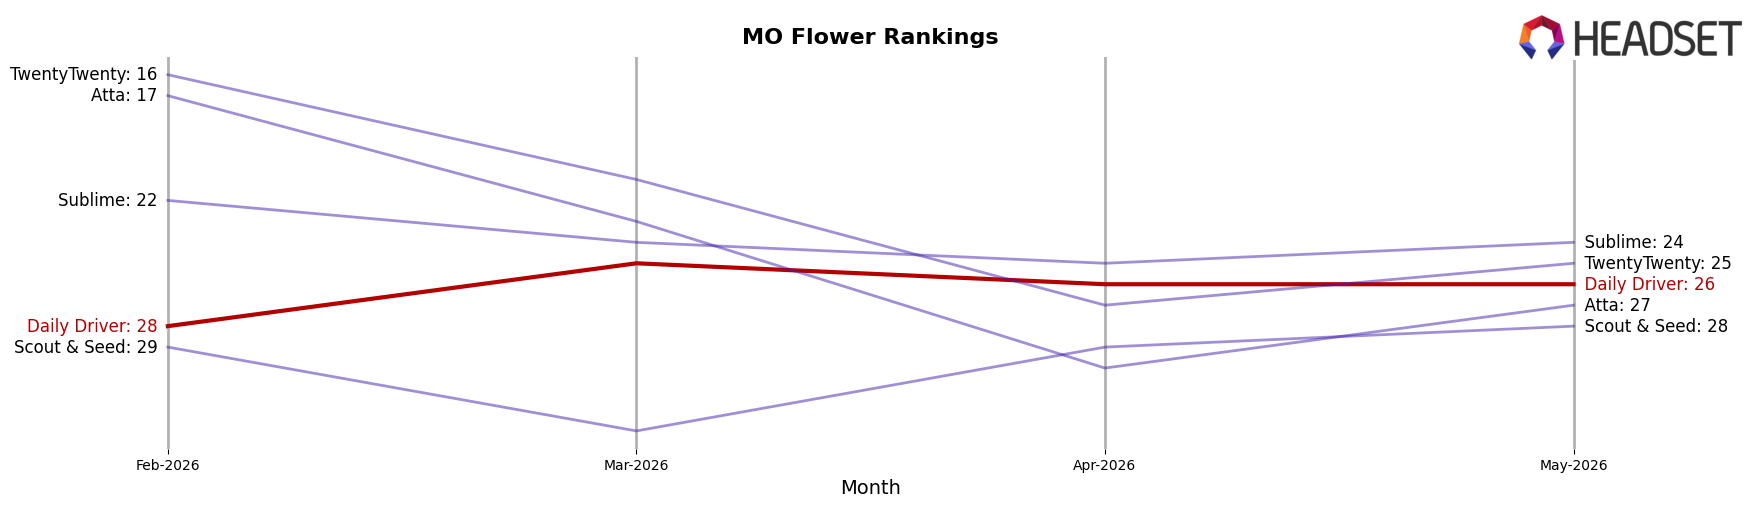
Daily Driver sits at rank #26 in MO Flower for May 2026, up 2 spots from #28 in February 2026, while its peak of #24 in January 2026 indicates a 2-position slide from its best month; without a reported year-over-year rank, the near-term rise contrasts with top-tier dynamics where Flora Farms holds #1 despite a -17.8% YoY sales change and Illicit / Illicit Gardens advances to #2 from #3 alongside +5.8% YoY growth. Meanwhile, CODES sits at #3 after slipping from #2 with a -30.6% YoY sales change, and Sinse Cannabis is #4, up from #5 on +27.5% YoY growth, signaling that Daily Driver’s modest rank lift amid churn at the top implies a window to reclaim a top-25 position if it converts short-term momentum into sustained share gains.
Notable Products
Daily Driver’s Purple Pineapple (3.5g) posted the steepest movement in May 2026 with a -54.2% month-over-month drop to $17,145 while falling to rank 7, implying a sharp rotation away from this SKU as attention consolidated elsewhere. In contrast, Dulce De Uva (3.5g) surged +54.5% MoM to rank 1 from below, and Mango Haze (3.5g) slid -16.8% MoM to rank 3, signaling demand concentrating at the top while mid-tier velocity thinned. With four of the top ten being Flower SKUs in the 3.5g format and Strawberry Candy (3.5g) climbing +37.5% MoM at rank 5, the mix points to a tightening winner-take-most dynamic within a single size that elevates a few leaders while culling underperformers.
Top Selling Cannabis Brands
Data for this report comes from real-time sales reporting by participating cannabis retailers via their point-of-sale systems, which are linked up with Headset’s business intelligence software. Headset’s data is very reliable, as it comes digitally direct from our partner retailers. However, the potential does exist for misreporting in the instance of duplicates, incorrectly classified products, inaccurate entry of products into point-of-sale systems, or even simple human error at the point of purchase. Thus, there is a slight margin of error to consider. Brands listed on this page are ranked in the top twenty within the market and product category by total retail sales volume.

