Market Insights Snapshot
The performance of Habitat in the Michigan market for the Flower category has shown some fluctuations over the last few months of 2025. Despite not making it into the top 30 rankings, Habitat's position shifted from 54th in September to 67th in October, then improved slightly to 61st in November before falling again to 65th in December. This movement suggests a volatile presence in the Michigan market, indicating potential challenges in maintaining a stable position. However, a notable sales increase occurred in November, suggesting a temporary resurgence in demand or successful promotional activities during that period.
In Missouri, Habitat's Flower category maintained a more consistent performance, with rankings hovering in the mid-20s throughout the last quarter of 2025. This consistency reflects a steadier market presence compared to Michigan. The Pre-Roll category, however, presents a contrasting picture. After a ranking of 66th in September, Habitat did not appear in the top 30 for October and November, only to re-emerge at 54th in December. This re-entry into the rankings could indicate a strategic shift or a successful campaign to boost sales in this category. The absence in the top 30 for two consecutive months highlights a challenge in maintaining visibility in the competitive Pre-Roll market segment.
Competitive Landscape
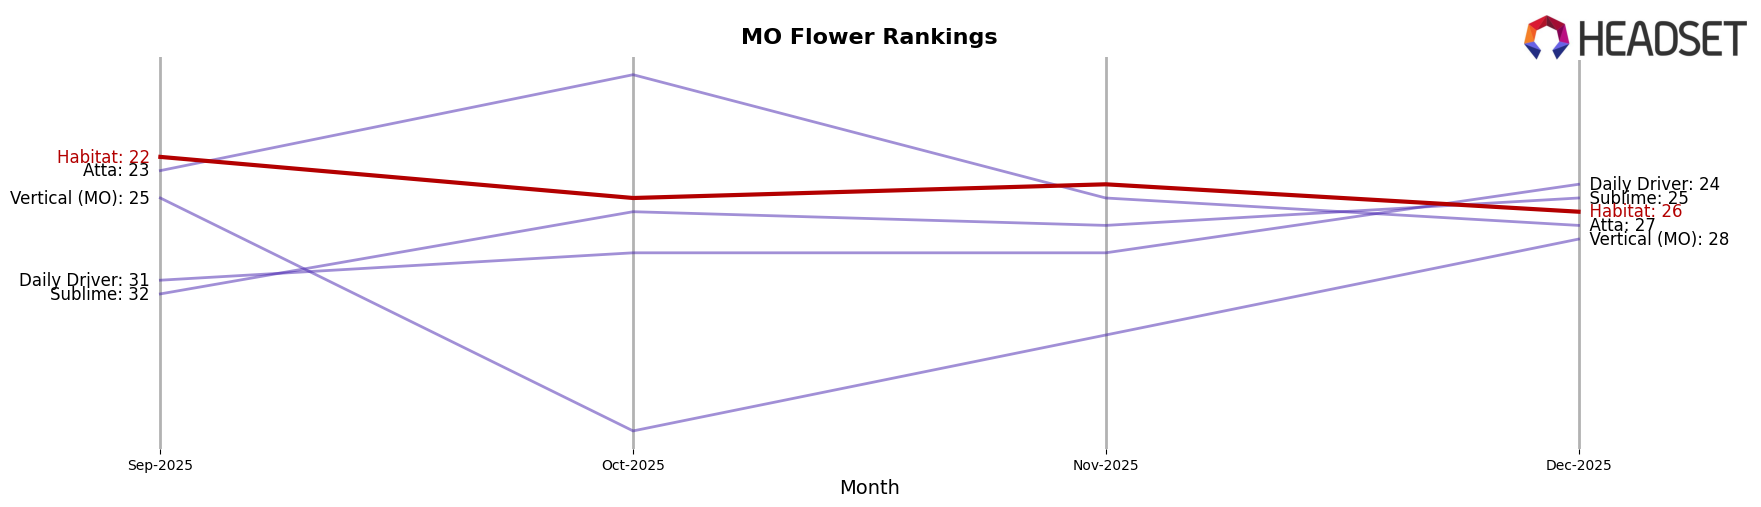
In the competitive landscape of the Flower category in Missouri, Habitat has experienced fluctuating rankings from September to December 2025, indicating a dynamic market environment. Despite a slight decline in rank from 22nd in September to 26th in December, Habitat has maintained a relatively stable sales volume, suggesting resilience amidst competitive pressures. Notably, Sublime and Daily Driver have shown upward trends in both rank and sales, with Daily Driver climbing from 31st to 24th and achieving higher sales than Habitat by December. Meanwhile, Atta and Vertical (MO) have experienced more volatility, with Atta dropping from 16th to 27th and Vertical (MO) recovering to 28th after a dip in October. These shifts highlight the competitive pressures Habitat faces, emphasizing the need for strategic marketing and product differentiation to regain and sustain higher market positions.
Notable Products
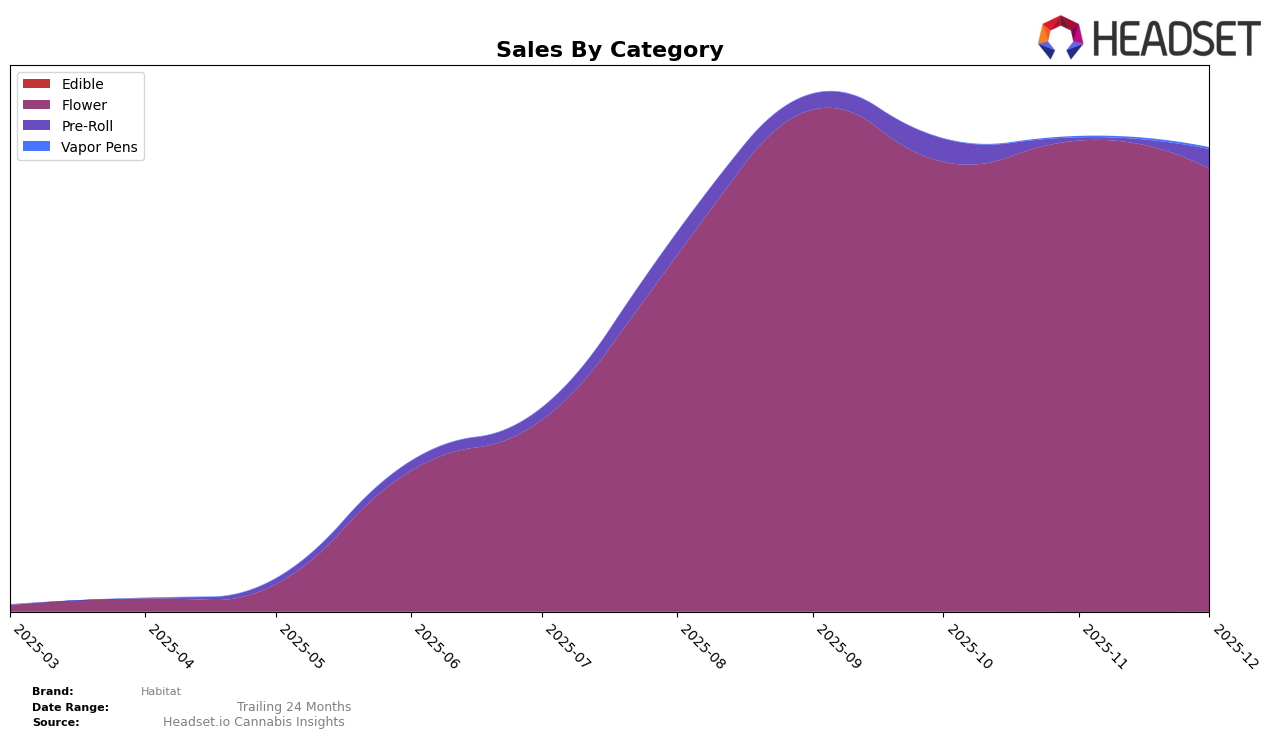
In December 2025, Berry Invasion (28g) emerged as the top-performing product for Habitat, achieving the number one rank with sales of 1999 units. Jet Fuel Gelato (Bulk) maintained a strong position, ranking second, although its sales decreased slightly from previous months. Cosmoconda (28g) secured the third rank, marking its first appearance in the top three. The product 996 (Bulk) held steady in fourth place, showing a consistent performance throughout the months. Cosmic Kush (Bulk) rounded out the top five, dropping two positions from its peak in October, indicating a slight decline in its ranking.
Top Selling Cannabis Brands
Data for this report comes from real-time sales reporting by participating cannabis retailers via their point-of-sale systems, which are linked up with Headset’s business intelligence software. Headset’s data is very reliable, as it comes digitally direct from our partner retailers. However, the potential does exist for misreporting in the instance of duplicates, incorrectly classified products, inaccurate entry of products into point-of-sale systems, or even simple human error at the point of purchase. Thus, there is a slight margin of error to consider. Brands listed on this page are ranked in the top twenty within the market and product category by total retail sales volume.

