Jun-2026
Sales
Trend
6-Month
Product Count
SKUs
Avg Price
YoY Sales Change
YoY Price Change
Market Insights Snapshot
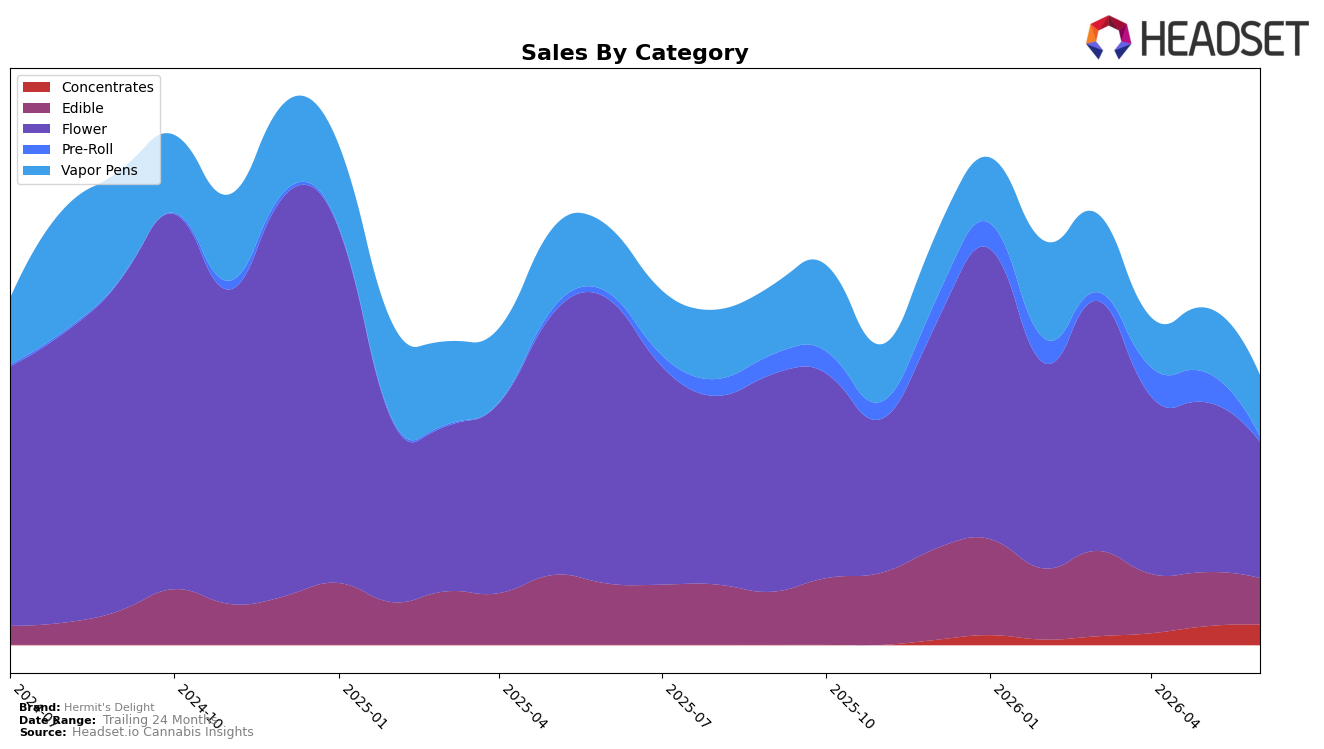
In June 2026, Hermit's Delight concentrated half of sales in Flower at 50.54% share but with a year-over-year decline of 52.26% and a month-over-month drop of 20.03%, while Vapor Pens held 22.76% share with a lighter 7.54% YoY decline and a 4.55% MoM dip. Edible accounted for 17.22% share with a 24.06% YoY contraction and a 14.09% MoM pullback, whereas Concentrates rose 9.46% MoM to 7.56% share despite no YoY read, and Pre-Roll collapsed 82.63% MoM to 1.93% share alongside a 12.52% YoY decrease. With average price down 12.49% YoY to $26.21 and Flower ranked 38th in Missouri, the mix shift toward lower-decline Vapor Pens and a nascent MoM uptick in Concentrates implies the brand is relying less on a weakening Flower anchor and edging toward categories with relatively milder pressure.
The combined effect of a 52.26% YoY contraction in Flower (still 50.54% of sales) and only a 7.54% YoY decline in Vapor Pens (22.76% share) positions Hermit's Delight as overexposed to a lagging primary category while its secondary format carries comparatively steadier demand. The 9.46% MoM increase in Concentrates versus a 20.03% MoM decline in Flower and an 82.63% MoM fall in Pre-Roll suggests trading into potency-driven niches while trimming low-velocity SKUs, and the 12.49% YoY average price decrease alongside a 14.09% MoM pullback in Edible indicates price-led defense is insufficient without further reweighting. The implication is that near-term positioning should pivot toward Vapor Pens and Concentrates to counter a rank of 38 in Flower and reduce volatility tied to categories posting double-digit MoM declines.
Competitive Landscape
Hermit's Delight sits at rank #38 in Missouri Flower for June 2026, down 13 positions year over year from #25, and 7 spots below its March 2026 level of #31; compared with its peak of #20 in October 2024, the brand is 18 ranks lower, indicating sustained slippage. Meanwhile, Flora Farms held #1 year over year at #1 despite a -5.1% sales YoY change, and Sinse Cannabis moved up from #5 to #2 with +33.2% YoY sales growth, outpacing Hermit's Delight’s rank decline; Amaze Cannabis also advanced from #6 to #4 with +43.8% YoY sales, widening the competitive gap. The pattern implies Hermit's Delight is losing relative velocity as faster-rising peers translate double-digit YoY gains into rank climbs while Hermit's Delight absorbs double-digit rank erosion.

Notable Products
Karbon Kool-Aid Pre-Roll (1g) posted the steepest decline, down 37.7% month over month and sliding to rank 5, while Osage Orange Distillate Cartridge (1g) rose 20.6% MoM to rank 4. Cheddar Cheeze (3.5g) held rank 1 and Super Buff Cherry (3.5g) sat at rank 2, placing Flower in three of the top ten slots even as one Pre-Roll contracted sharply. With Vapor Pens occupying ranks 3, 4, 6, and 9 and contributing four of the top ten SKUs, the mix points to a pivot toward inhalable consistency anchored by cartridges while trimming exposure to volatile Pre-Rolls.
Top Selling Cannabis Brands
Data for this report comes from real-time sales reporting by participating cannabis retailers via their point-of-sale systems, which are linked up with Headset’s business intelligence software. Headset’s data is very reliable, as it comes digitally direct from our partner retailers. However, the potential does exist for misreporting in the instance of duplicates, incorrectly classified products, inaccurate entry of products into point-of-sale systems, or even simple human error at the point of purchase. Thus, there is a slight margin of error to consider. Brands listed on this page are ranked in the top twenty within the market and product category by total retail sales volume.

