Jun-2026
Sales
Trend
6-Month
Product Count
SKUs
Avg Price
YoY Sales Change
YoY Price Change
Market Insights Snapshot
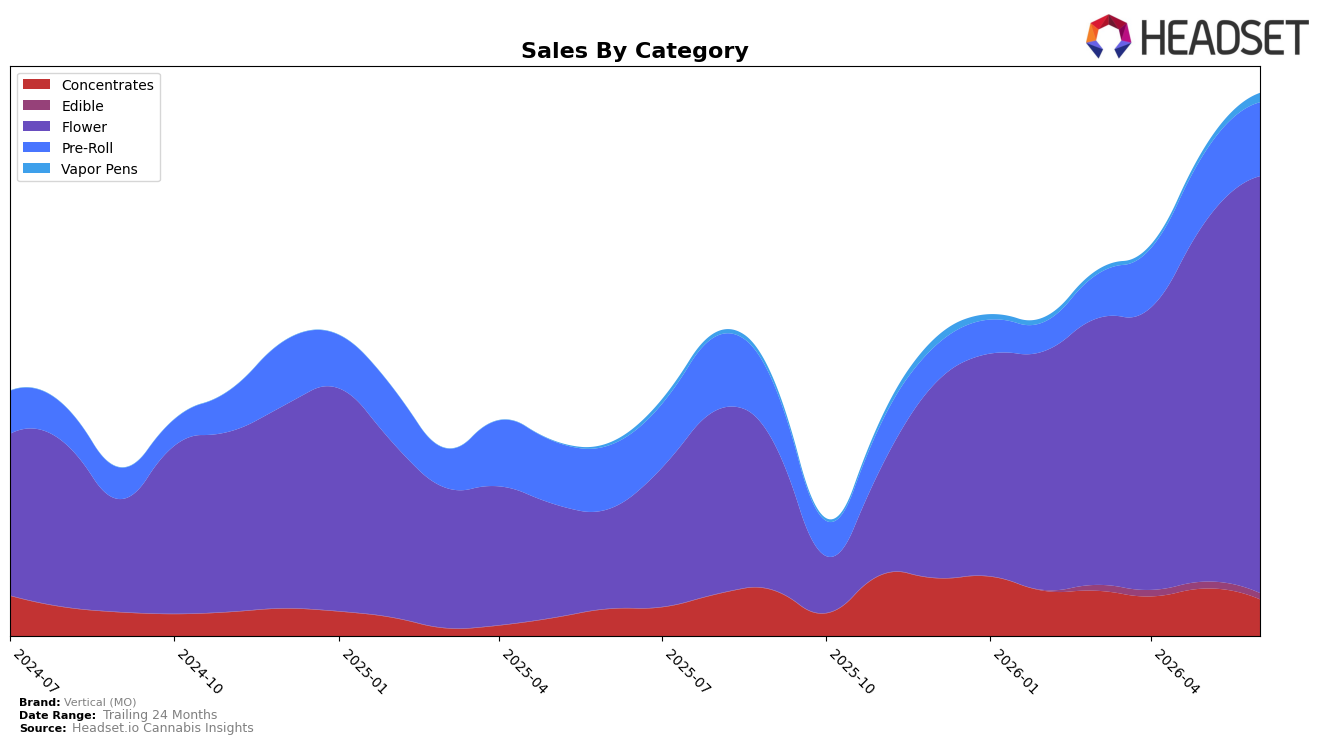
Vertical (MO) concentrated 76.92% of sales in Flower in June 2026, up 16.16% month over month and 320.15% year over year, while Pre-Roll held 13.57% share with 5.62% MoM and 16.42% YoY growth. Vapor Pens remained a small 1.67% share but jumped 79.80% MoM and 318.82% YoY, contrasting with Concentrates at 6.76% share falling 22.76% MoM despite a 36.36% YoY gain; Edible slipped 9.81% MoM at 1.09% share. Against this mix, the brand’s average price fell 9.78% YoY to $25.52 as mix skewed to lower-priced Pre-Roll and Vapor Pens even while high-ticket Flower averaged $30.80, implying share capture through price-accessible formats alongside Flower volume expansion in Missouri.
The pattern implies Vertical (MO) is anchoring its positioning around Flower scale while using Vapor Pens’ 79.80% MoM surge and Pre-Roll’s 13.57% share to widen entry points, supporting a 183.14% YoY brand sales increase and a 12th-place Flower rank. The 22.76% MoM pullback in Concentrates alongside a 9.81% MoM decline in Edible suggests de‑prioritization of niche segments, while the 318.82% YoY rise in Vapor Pens and 320.15% YoY expansion in Flower indicate dual engines for traffic and basket-building; together with a 9.78% YoY price decrease, this positions the brand toward value-led trade-up within Flower and trial-led penetration via lighter formats in Missouri.
Competitive Landscape
Vertical (MO) sits at rank #12 in MO Flower in June 2026 after climbing 26 positions year over year from #38, and it improved 7 spots versus March 2026 when it was #19; the current #12 also matches its peak rank to date in June 2026. In contrast, Flora Farms held #1 while posting a -5.1% year-over-year sales change, and Sinse Cannabis moved up from #5 to #2 with a 33.2% sales increase, indicating that Vertical (MO) is gaining ladder position faster than some incumbents despite mixed competitor momentum. The pattern implies Vertical (MO)’s rapid rank ascent from #38 to #12 alongside a 7-place lift since March 2026 positions it on a trajectory where continued share capture could push it into the top 10 as early as late 2026.

Notable Products
Lemon Fresh (3.5g) posted the steepest decline in June 2026 at -38.9% MoM, sliding to rank 7, while LA Kush Cake (3.5g) surged 60.7% to rank 4, signaling a sharp redistribution of demand within the same month. Gush Mints (3.5g) also jumped 58.8% to rank 6 as Applescotti (3.5g) rose 49.8% at rank 1, and four of the top ten are Flower SKUs concentrated in 3.5g formats that collectively pulled share upward despite one major laggard. Jokerz Candy (3.5g) advanced 40.7% at rank 2, and Grape Bubblegum (3.5g) increased 36.1% at rank 3, indicating momentum clustered at the very top while Pineapple Donut (3.5g) was nearly flat at +2.8% at rank 10. The pattern implies Vertical (MO) is leaning into a few fast-accelerating 3.5g Flower winners to carry mix while tolerating volatility in citrus-leaning profiles, pointing to a strategy that prioritizes rapid-turn SKUs over broad SKU stability.
Top Selling Cannabis Brands
Data for this report comes from real-time sales reporting by participating cannabis retailers via their point-of-sale systems, which are linked up with Headset’s business intelligence software. Headset’s data is very reliable, as it comes digitally direct from our partner retailers. However, the potential does exist for misreporting in the instance of duplicates, incorrectly classified products, inaccurate entry of products into point-of-sale systems, or even simple human error at the point of purchase. Thus, there is a slight margin of error to consider. Brands listed on this page are ranked in the top twenty within the market and product category by total retail sales volume.

