.svg)


Where to Buy
Daybreak Cannabis is stocked at 81 licensed dispensaries across Missouri, Georgia, and Oklahoma, 62 of them in Missouri, with the deepest coverage in Kansas City, St. Louis, Branson, Cape Girardeau, and Columbia. Search by ZIP code or city below to find the closest one, or filter by product type if you are after a specific format.
Market Insights Snapshot
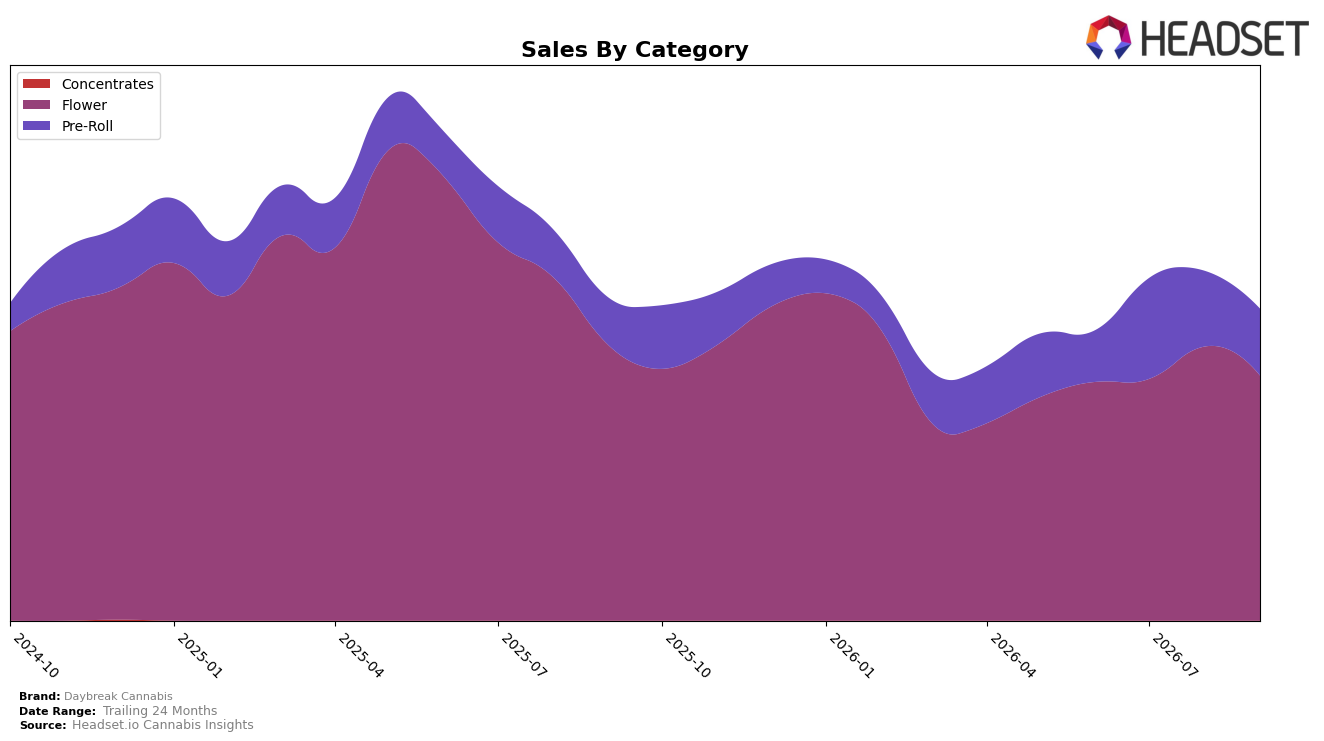
Daybreak Cannabis concentrated 78.62% of sales in Flower in September 2026, where category revenue fell 11.12% year over year and 10.60% month over month, while the smaller Pre-Roll slice at 21.38% grew 41.14% year over year but slipped 11.65% month over month; the brand’s overall sales declined 3.48% year over year alongside a 14.25% drop in average price, and Flower held rank 11 in Missouri. The mix now leans on a contracting flagship category while the only growing category by year over year, Pre-Roll, remains too small to offset double-digit Flower declines, implying the current portfolio weighting keeps the brand tethered to a down-trending core.
With Flower down 11.12% year over year and 10.60% month over month but still commanding 78.62% share, and Pre-Roll up 41.14% year over year yet only 21.38% of sales and down 11.65% month over month, the brand’s price-led strategy (average price down 14.25% year over year) has not converted into month-over-month unit momentum. Holding rank 11 in Missouri Flower while the portfolio remains concentrated in that category indicates the brand’s positioning is anchored in a mid-pack Flower stance that compresses margins without gaining monthly share, implying near-term defensiveness unless mix shifts further toward higher-velocity Pre-Rolls or Flower regain reverses.
Competitive Landscape
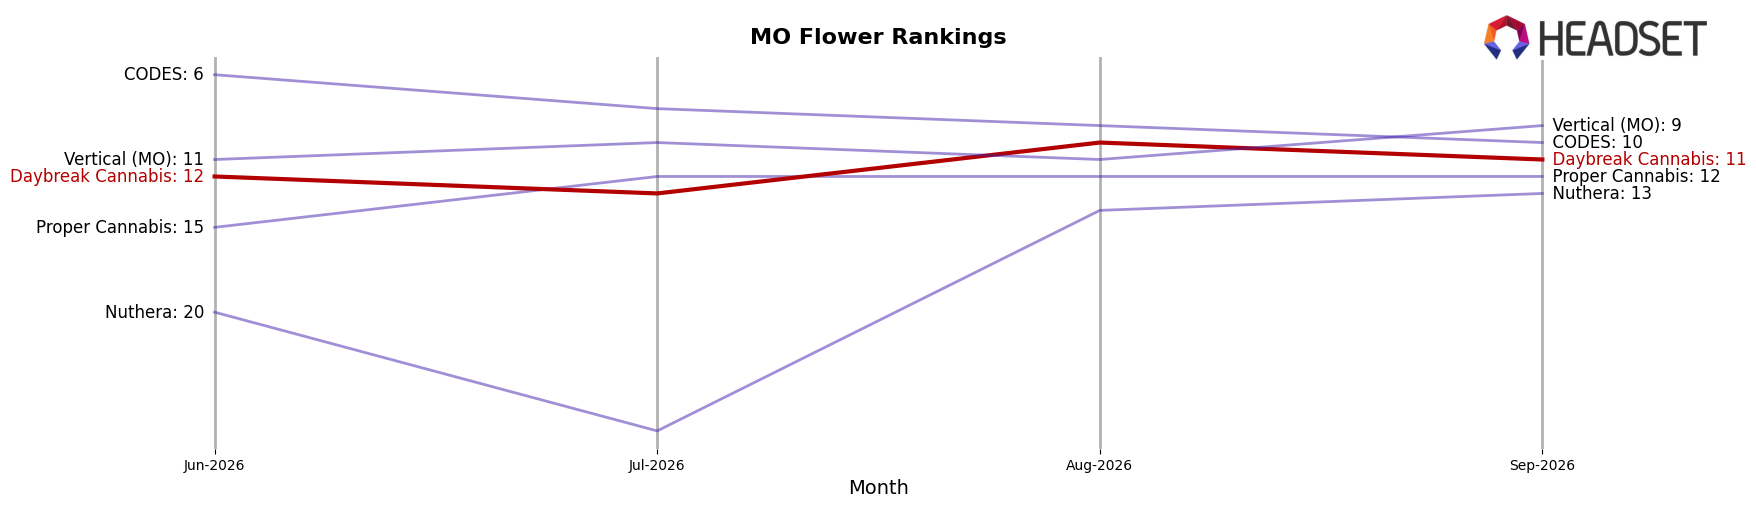
Daybreak Cannabis sits at rank #11 in MO Flower for September 2026, unchanged year over year from #11, while improving 1 position versus June 2026 when it was #12; against this static YoY rank, category leaders moved: Flora Farms held #1 year over year while growing sales by 33%, and Amaze Cannabis climbed from #6 to #2 with roughly 19.8% sales growth, signaling faster momentum above Daybreak. Despite a historical peak at #7 in July 2025, Daybreak’s flat YoY rank at #11 and only a 1-position uptick in the last three months, alongside competitors like Sinse Cannabis staying at #3 despite an 11.1% sales decline and Vibe Cannabis (MO) rising from #7 to #5 with 16.4% growth, implies Daybreak’s current trajectory is one of stability that risks ceding share to faster risers unless it converts stability into upward rank movement.
Notable Products
Spec Ops Pre-Roll (1g) posted the steepest movement in September 2026 with a -62.3% month-over-month drop while sitting at rank 3, contrasting with Red Runtz Popcorn (Bulk) at rank 5 rising +56.8% MoM and indicating volatility concentrated at the top of the lineup. Trilla Pre-Roll (1g) held rank 1 with no reported MoM change and Pink Lemonade (Bulk) at rank 8 slipped -2.0% MoM, and with eight of the top ten SKUs in Flower or Pre-Roll formats the mix is anchored in value-driven inhalables. The presence of two Pre-Rolls in ranks 1–3 alongside five Flower SKUs in ranks 4–10 points to a barbell between premium-positioned singles and bulk Flower, implying Daybreak Cannabis is leaning into price-tier diversification to sustain share despite sharp swings in individual SKUs.
Top Selling Cannabis Brands






Data for this report comes from real-time sales reporting by participating cannabis retailers via their point-of-sale systems, which are linked up with Headset’s business intelligence software. Headset’s data is very reliable, as it comes digitally direct from our partner retailers. However, the potential does exist for misreporting in the instance of duplicates, incorrectly classified products, inaccurate entry of products into point-of-sale systems, or even simple human error at the point of purchase. Thus, there is a slight margin of error to consider. Brands listed on this page are ranked in the top twenty within the market and product category by total retail sales volume.

