Jun-2026
Sales
Trend
6-Month
Product Count
SKUs
Avg Price
YoY Sales Change
YoY Price Change
Market Insights Snapshot
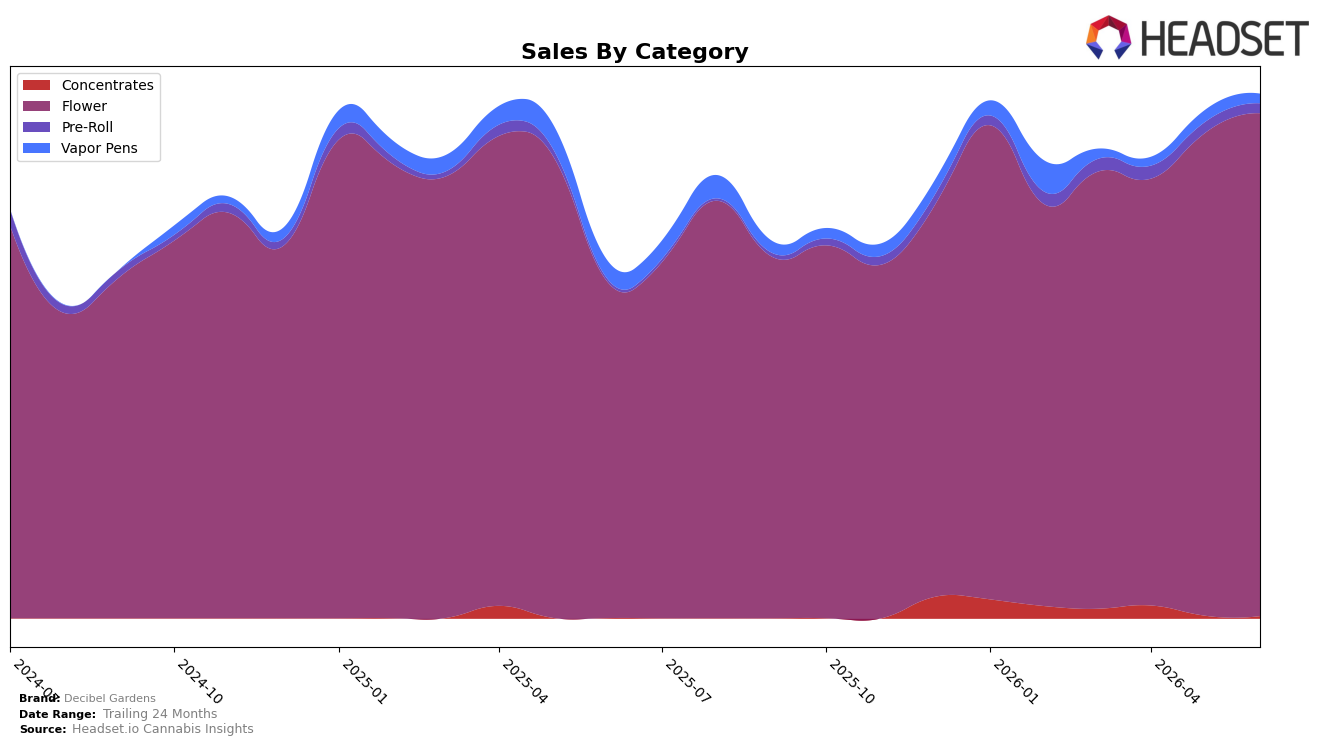
Decibel Gardens concentrated 96.01% of June 2026 sales in Flower, where year-over-year growth of 50.06% outpaced the brand’s total 47.24% and coincided with a month-over-month gain of 4.26%; in contrast, Vapor Pens fell 48.81% YoY with a 21.07% MoM slide while holding just 1.76% share. Pre-Roll expanded 291.03% YoY but contracted 10.19% MoM to 1.81% share, and Concentrates spiked 927.02% YoY yet dipped 17.37% MoM to 0.42% share; with California Flower rank at 22 and an average price down 0.83% YoY to $40.02, the mix indicates momentum is anchored in Flower while peripheral formats remain small and volatile.
The pattern implies Decibel Gardens is trading depth for breadth: reinforcing Flower scale (96.01% share, rank 22 in California Flower) while tolerating sharp variability in low-share extensions, where MoM retrenchment in Vapor Pens (-21.07%) and Pre-Roll (-10.19%) curbs diversification despite triple-digit YoY spikes. With Flower’s 50.06% YoY lift exceeding the brand’s 47.24% and a modest price deflation of 0.83% YoY, the positioning leans on value-accretive Flower volume rather than premiumization or cross-category spread, signaling that near-term share gains will hinge more on sustaining Flower velocity than on rapid expansion of the 1–2% share adjuncts.
Competitive Landscape
Decibel Gardens sits at rank #22 in California Flower in June 2026 after rising 14 positions from #36 year over year, and it has inched up 2 spots since March 2026 when it was #24; by contrast, STIIIZY moved from #2 to #1 while growing sales 62.5% YoY, and CAM advanced from #3 to #2 with 56.2% YoY growth, indicating that category leaders are accelerating faster than mid-tier climbers. Hitting a peak rank of #22 in June 2026 while the top three condensed their positions (#1, #2, #3) suggests Decibel Gardens’ upward trajectory is real but paced, implying near-term gains will depend on capturing share from neighbors just above rather than dislodging the fastest-rising leaders.

Notable Products
C-Note (3.5g) posted the largest month-over-month gain at +52.1% while climbing to rank 7, and Decibel OG (3.5g) followed closely at +51.8% to rank 5, whereas Benjamins in Space (3.5g) fell -11.0% at rank 3. Roswell 47 (3.5g) and Miyazaki Mango (3.5g) held ranks 1 and 2 with +20.7% and +22.0% growth respectively, while Grape Punch (3.5g) slid -49.4% at rank 10. With all ten top products in Flower and two mid-pack SKUs surging more than 50% in June 2026, the mix implies a push to broaden velocity beyond the top two anchors and rebalance away from tail SKUs that are contracting.
Top Selling Cannabis Brands
Data for this report comes from real-time sales reporting by participating cannabis retailers via their point-of-sale systems, which are linked up with Headset’s business intelligence software. Headset’s data is very reliable, as it comes digitally direct from our partner retailers. However, the potential does exist for misreporting in the instance of duplicates, incorrectly classified products, inaccurate entry of products into point-of-sale systems, or even simple human error at the point of purchase. Thus, there is a slight margin of error to consider. Brands listed on this page are ranked in the top twenty within the market and product category by total retail sales volume.

