.svg)

Sep-2026
Sales
Trend
6-Month
Product Count
SKUs
Avg Price
YoY Sales Change
YoY Price Change


Where to Buy
Eighth Brother, Inc. is stocked at 152 licensed dispensaries across California, with the deepest coverage in Los Angeles, Sacramento, San Francisco, San Jose, and San Diego. Search by ZIP code or city below to find the closest one, or filter by product type if you are after a specific format.
Market Insights Snapshot
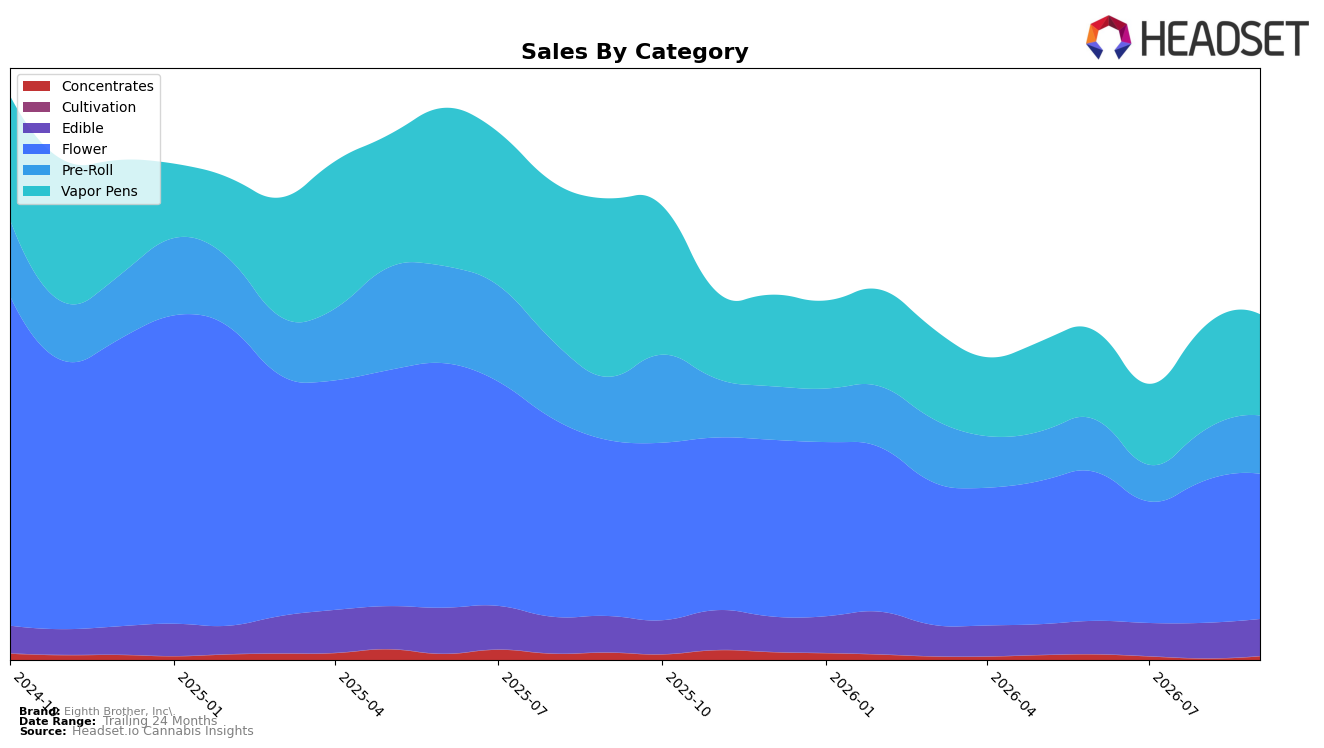
Eighth Brother, Inc. concentrated 42.12% of September 2026 sales in Flower with a 2.18% month-over-month lift despite a 17.48% year-over-year decline, while Vapor Pens held 29.34% share with a 2.42% month-over-month drop and a 43.33% year-over-year contraction. Pre-Roll expanded to 16.85% share with 15.35% month-over-month growth against a 7.98% year-over-year dip, and Edible reached 10.66% share with 4.31% month-over-month and 1.62% year-over-year increases; Concentrates remained a 1.03% share niche but spiked 190.43% month-over-month amid a 50.07% year-over-year decline. With overall brand sales down 25.19% year over year and average price down 3.26%, the mix shift toward Pre-Roll and Edible indicates short-cycle volume tactics are cushioning declines in Vapor Pens while Flower stability supports baseline demand.
These shifts position the brand to lean into value-accessible formats as a defensive play: Pre-Roll’s 15.35% month-over-month surge alongside Edible’s 4.31% month-over-month and 1.62% year-over-year gains point to price-sensitive acquisition and repeat behavior, while Vapor Pens’ 43.33% year-over-year contraction signals a need to reframe assortment rather than chase price down. Holding rank 33 in Flower in California with a 42.12% sales share and a 2.18% month-over-month lift suggests Flower can be a positioning anchor, and the 190.43% month-over-month rebound in Concentrates at a 1.03% share offers a test bed for targeted innovation without material margin risk.
Competitive Landscape
Eighth Brother, Inc. sits at rank #33 in CA Flower for September 2026, down 6 positions year over year from #27 and 2 spots below its June 2026 mark of #31, while also standing far from its peak of #12 in September 2024; in contrast, STIIIZY holds #1 after improving from #2 with a 47.8% YoY sales increase and CAM climbed from #3 to #2 with 28.9% YoY growth, whereas CannaBiotix (CBX) slipped from #1 to #3 amid a 21.1% YoY sales decline; additionally, Oakfruitland surged from #11 to #5 with 73.5% YoY growth, amplifying competitive pressure near the top tiers. The pattern—Eighth Brother, Inc. drifting from #27 to #33 YoY while leaders consolidate or accelerate—implies that regaining relevance will require re-entering the teens where it last peaked at #12, because the ladder is tightening as upward movers widen the gap.

Notable Products
Green Crack Distillate Disposable (1g) posted the steepest setback in September 2026 with a -20.3% month-over-month decline while sliding to rank 7, as Venom OG Pre-Roll (1g) fell -30.8% at rank 10, indicating pressure on trailing SKUs outside the top five. In contrast, Blackberry Kush Distillate Disposable (1g) climbed +28.6% to rank 5 and Blue Dream Distillate Disposable (1g) held rank 1 with +4.1% MoM, suggesting Vapor Pens are consolidating leadership even as Maui Waui Pre-Roll (1g) dropped -27.7% at rank 9. Four of the top ten are Pre-Roll SKUs, yet their mixed trajectory alongside Apple Fritter Distillate Disposable (1g) at +8.3% and rank 6 points to a tilt toward higher-velocity Distillate Disposables capturing share from softer Pre-Rolls. The pattern implies Eighth Brother, Inc. is pivoting toward a Vapor Pen-led lineup where a few high-ranking Distillate Disposables anchor momentum while lower-ranked Pre-Rolls rationalize.
Top Selling Cannabis Brands






Data for this report comes from real-time sales reporting by participating cannabis retailers via their point-of-sale systems, which are linked up with Headset’s business intelligence software. Headset’s data is very reliable, as it comes digitally direct from our partner retailers. However, the potential does exist for misreporting in the instance of duplicates, incorrectly classified products, inaccurate entry of products into point-of-sale systems, or even simple human error at the point of purchase. Thus, there is a slight margin of error to consider. Brands listed on this page are ranked in the top twenty within the market and product category by total retail sales volume.

