Market Insights Snapshot
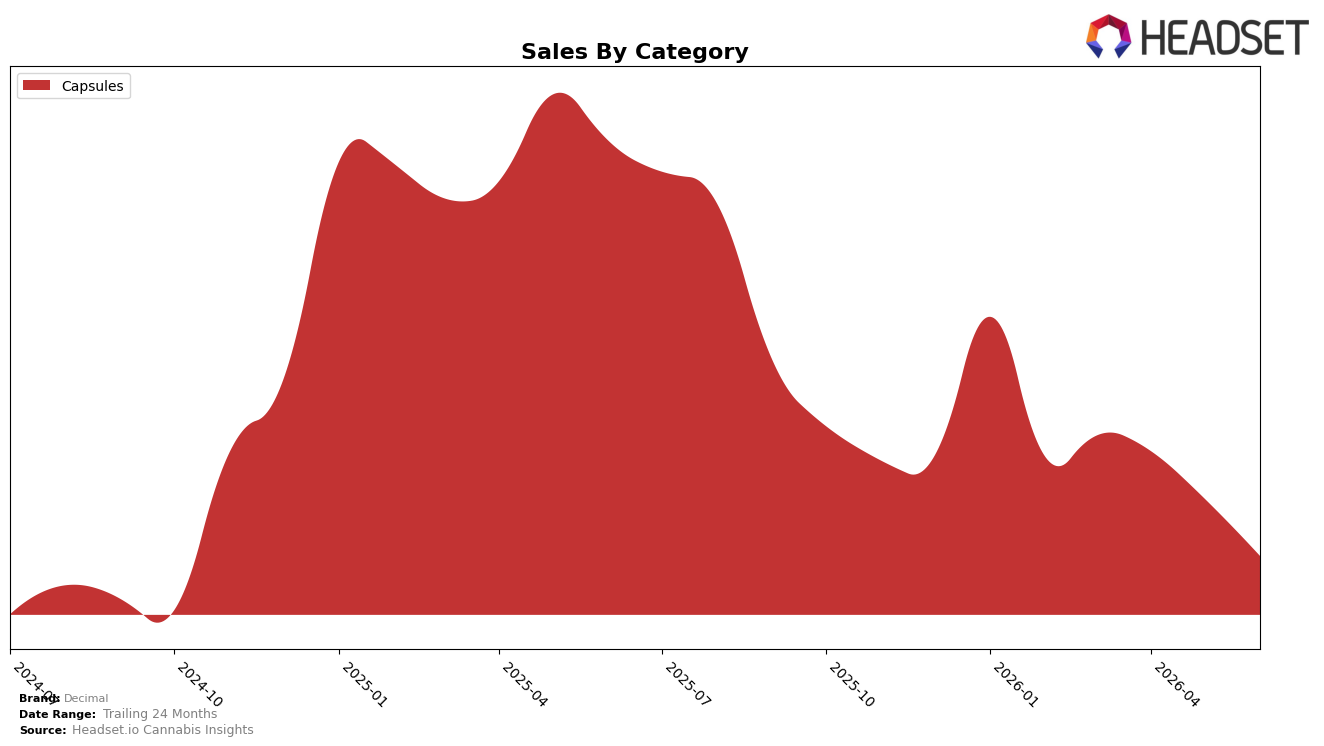
In June 2026, Decimal concentrated 100.0% of sales in Capsules, with category sales down 55.9% year over year and 14.9% month over month, while the average price declined 5.4% YoY to $37.31. Within the Capsules market in Ontario, Decimal held rank 7, signaling a mid-pack position as both share and velocity likely compressed versus May 2026 and June 2025; the implication is that reliance on a single category amplified volatility and exposed the brand to deeper rank pressure when demand eased.
The tightening to a single-category footprint alongside a YoY sales contraction of 55.9% and a MoM dip of 14.9% indicates positioning skewed toward a narrower shopper mission and limited basket roles, even as a 5.4% YoY price decrease suggests tactics aimed at maintaining throughput rather than premium expansion. Being rank 7 in Capsules in Ontario during June 2026, coupled with 100.0% category concentration, implies Decimal’s competitive posture is sensitive to incremental price and distribution shifts; the pattern points to a need for diversification or differentiated Capsules propositions to stabilize rank and reduce exposure to month-to-month swings.
Competitive Landscape
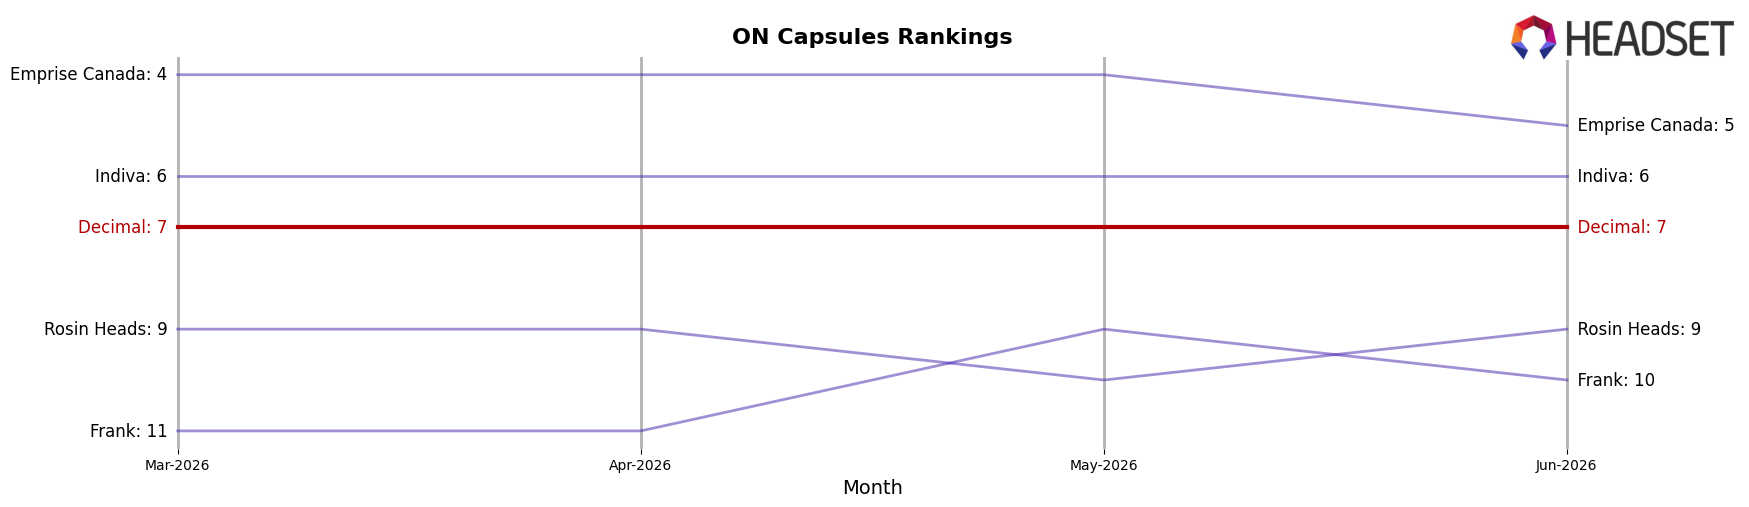
Decimal sits at #7 in ON Capsules in June 2026, unchanged YoY from #7, with no movement over the past three months and a peak rank of #7 also in June 2026; in contrast, Glacial Gold climbed from #4 to #2 while growing sales 45.7% YoY and Redecan slipped from #2 to #3 alongside a 41.2% YoY decline. With Aspire steady at #1 and up 19.9% YoY, Decimal’s flat rank trajectory at #7 versus both June 2025 and March 2026 indicates share is being capped by faster-moving competitors, implying a need to disrupt the middle tier to avoid prolonged entrenchment at the category fringe.
Notable Products
CBD:THC 1:1 Balance Softgels 30-Pack (150mg CBD, 150mg THC) posted the steepest drop at -36.34% MoM while sliding to rank 3, and CBD Capsules 90-Pack (1800mg CBD) fell -30.97% MoM at rank 4, indicating demand cooled most sharply in non-THC-dominant formats. THC 10 Softgels 30-Pack (300mg) still held rank 1 despite a -24.68% MoM decline, whereas THC Capsules 90-Pack (900mg) in rank 2 was effectively flat at +0.64% MoM, together signaling that THC-led SKUs are defending the top ranks as mixed and CBD-led variants contract. All five top-5 SKUs are Capsules, concentrating 100% of the leaderboard in one format with only one dollar figure of $27,991 attached to a near-flat performer, which implies Decimal’s portfolio is over-indexed to Capsules and reliant on THC-led entries to stabilize share even as mixed and CBD-heavy lines retrench.
Top Selling Cannabis Brands
Data for this report comes from real-time sales reporting by participating cannabis retailers via their point-of-sale systems, which are linked up with Headset’s business intelligence software. Headset’s data is very reliable, as it comes digitally direct from our partner retailers. However, the potential does exist for misreporting in the instance of duplicates, incorrectly classified products, inaccurate entry of products into point-of-sale systems, or even simple human error at the point of purchase. Thus, there is a slight margin of error to consider. Brands listed on this page are ranked in the top twenty within the market and product category by total retail sales volume.

