May-2026
Sales
Trend
6-Month
Product Count
SKUs
Avg Price
YoY Sales Change
YoY Price Change
Market Insights Snapshot
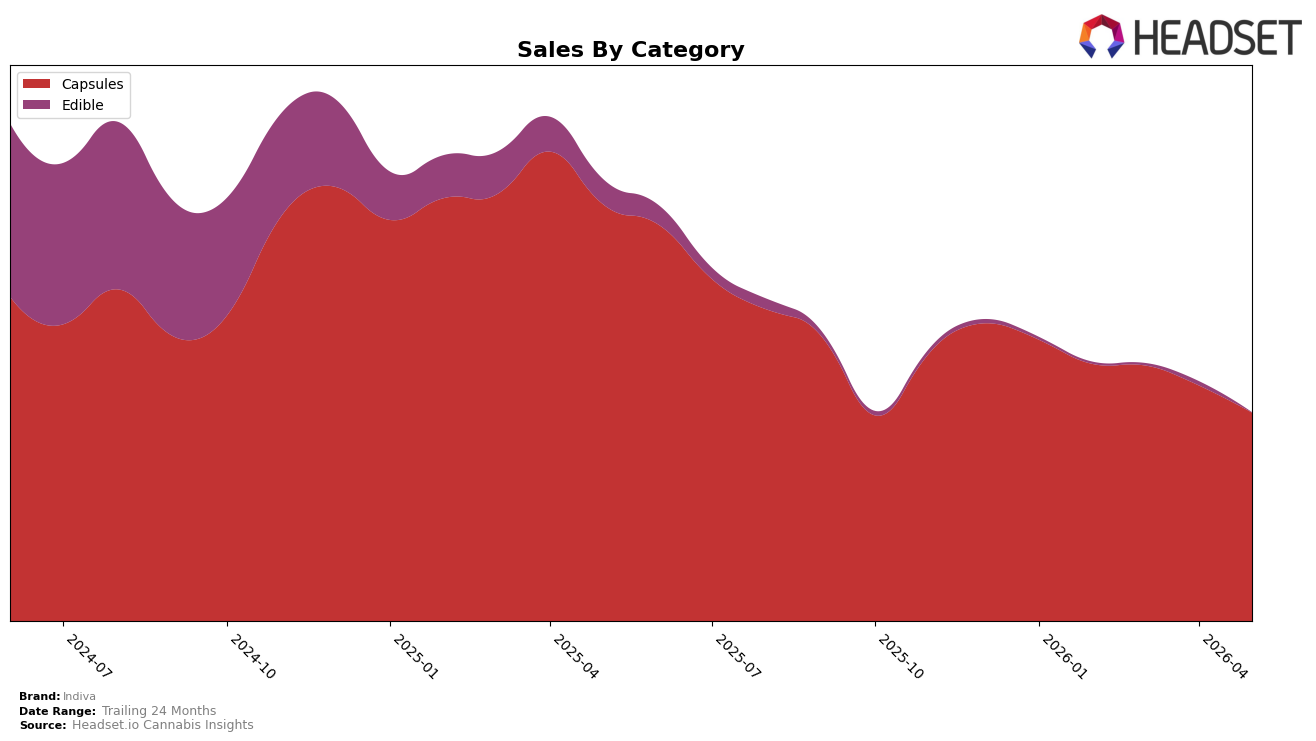
In May 2026, Indiva’s mix was almost entirely Capsules at 99.73% share while Edible accounted for 0.27%, with Capsules down 49.89% year over year and 11.53% month over month, and Edible down 97.75% year over year and 87.30% month over month. Despite a 35.88% year-over-year increase in average price to $31.49, total brand sales fell 52.64% year over year and 63.34% versus 24 months, implying that price lift did not offset volume declines and that category concentration magnified the downside as Capsules contracted more sharply than the overall brand.
Indiva’s rank of 3 in Capsules in British Columbia indicates defensible placement within its core category even as Capsules’ share concentration (99.73%) and double-digit month-over-month drop of 11.53% create sensitivity to further category swings. The 0.27% Edible share alongside an 87.30% month-over-month decline and a 97.75% year-over-year decline suggests the portfolio has limited ballast, so maintaining a rank of 3 while average prices rose 35.88% and brand sales declined 52.64% implies a position skewed toward premium-priced Capsules that may sustain rank but at the cost of volume resilience.
Competitive Landscape
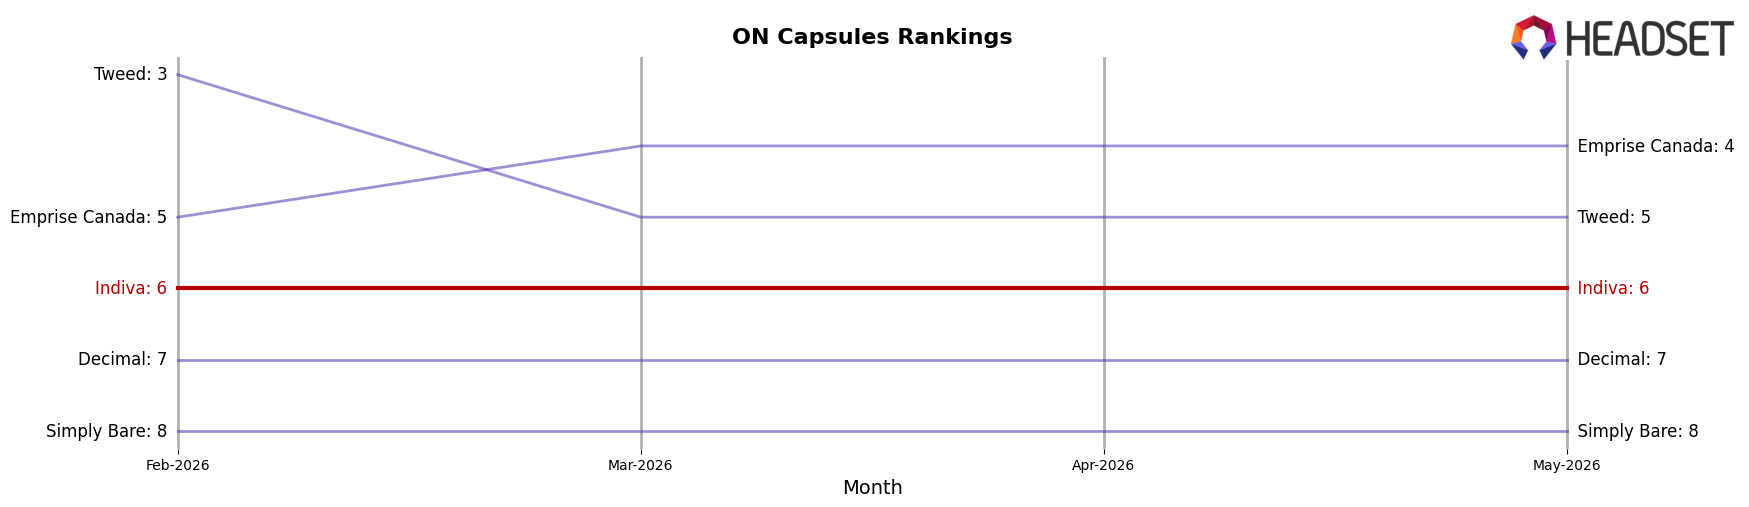
Indiva sits at #6 in ON Capsules for May 2026, unchanged from #6 year over year, and flat versus three months ago at #6, while its historical peak was #5 in April 2025; in contrast, Glacial Gold advanced from #4 to #2 with a 39.1% YoY sales increase and Tweed fell from #2 to #5 alongside a 47.4% YoY decline, indicating Indiva’s static rank is driven more by competitor reshuffling than by its own momentum, and implying that without a share-accretive move the brand risks being boxed into a mid-pack position as climbing rivals compress the path back to #5.
Notable Products
Vanilla Double Stuffed Chocolate Cookie (10mg) posted the largest movement in May 2026 with a +115.2% month-over-month change and rose to rank 4, while Dark Chocolate Bar (10mg) fell -94.1% and slid to rank 5. CBG/THC 1:2 Blips Tablets 20-Pack (100mg CBG, 200mg THC) surged +110.6% to rank 3, contrasting with Big Blips THC Tablets 55-Pack (550mg) dropping -10.9% yet holding rank 1. Four of the top six SKUs are Capsules, and the Capsules leader generated $108,811 alongside a -20.2% decline for Blips THC Tablets 25-Pack (250mg) at rank 2, implying Indiva’s mix is consolidating around high-dose and minor-cannabinoid capsule formats while legacy chocolate edibles retrench.
Top Selling Cannabis Brands
Data for this report comes from real-time sales reporting by participating cannabis retailers via their point-of-sale systems, which are linked up with Headset’s business intelligence software. Headset’s data is very reliable, as it comes digitally direct from our partner retailers. However, the potential does exist for misreporting in the instance of duplicates, incorrectly classified products, inaccurate entry of products into point-of-sale systems, or even simple human error at the point of purchase. Thus, there is a slight margin of error to consider. Brands listed on this page are ranked in the top twenty within the market and product category by total retail sales volume.

