.svg)


Where to Buy
Discos is stocked at 54 licensed dispensaries across Maryland and Oregon, 46 of them in Maryland, with the deepest coverage in Baltimore, Rockville, Annapolis, Columbia, and Edgewater. Search by ZIP code or city below to find the closest one, or filter by product type if you are after a specific format.
Market Insights Snapshot
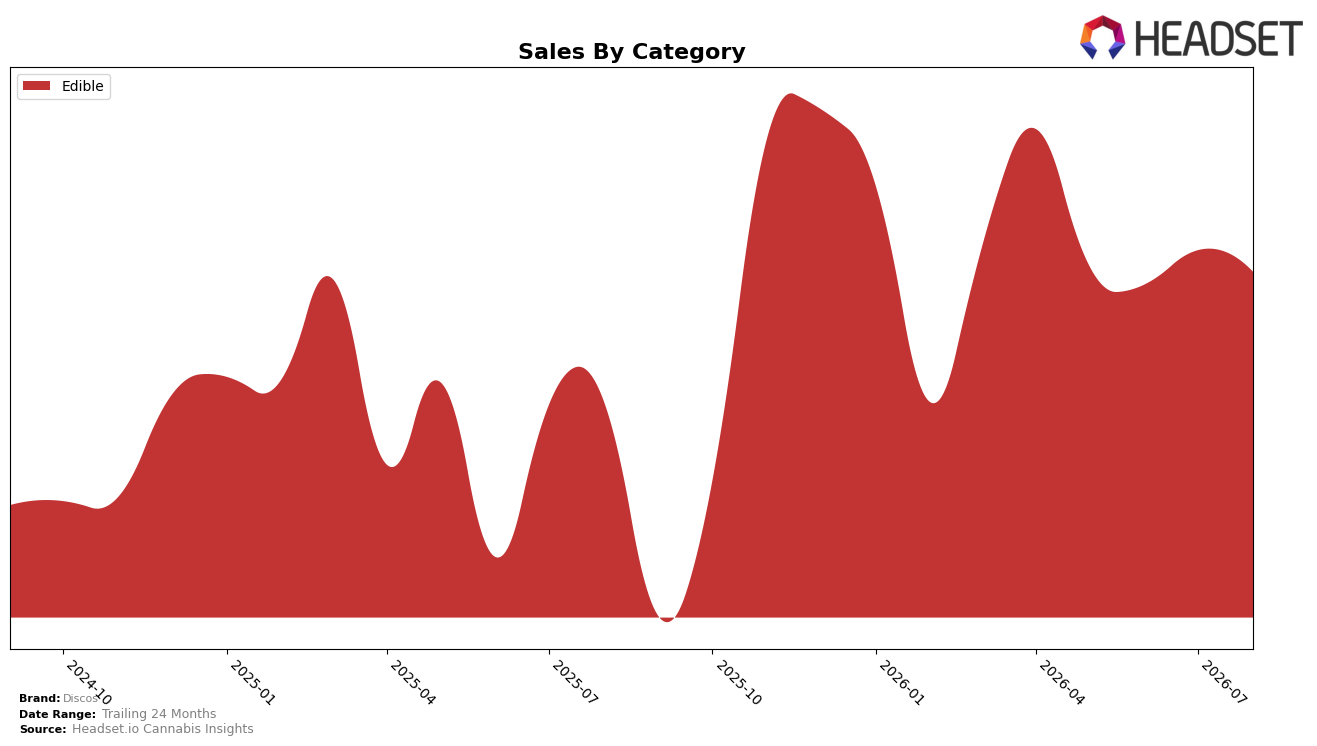
In August 2026, Discos operated as a single-category brand with Edible accounting for 100.0% of sales, yielding a concentrated mix that rose 14.66% year over year while dipping 2.08% month over month. The average price fell 15.68% YoY to $18.09, a sharper decline than the 2.08% MoM sales pullback, indicating that volume likely expanded even as revenue per unit compressed; within Maryland Edibles, the brand held rank 18. The pattern implies Discos traded price for share gains over the past year but encountered short-term elasticity limits in August 2026, suggesting revenue stability hinges on sustaining unit momentum within Edibles despite a lower price point.
The mix concentration in Edibles at 100.0%, combined with a 14.66% YoY lift against a 2.08% MoM slip and a 15.68% YoY price decline, positions Discos as a value-led Edible specialist rather than a cross-category hedge. Holding rank 18 in Maryland indicates mid-pack visibility where incremental rank gains likely depend on maintaining below-prior-year pricing while improving repeat rates; the 52.89% 24-month sales growth versus an August 2026 MoM contraction signals sensitivity to near-term demand cycles. The implication is a need to prioritize retention mechanics and format breadth within Edibles to convert price-driven trial into durable share, because the current pricing stance supports unit throughput but raises risk if seasonal demand weakens.
Competitive Landscape
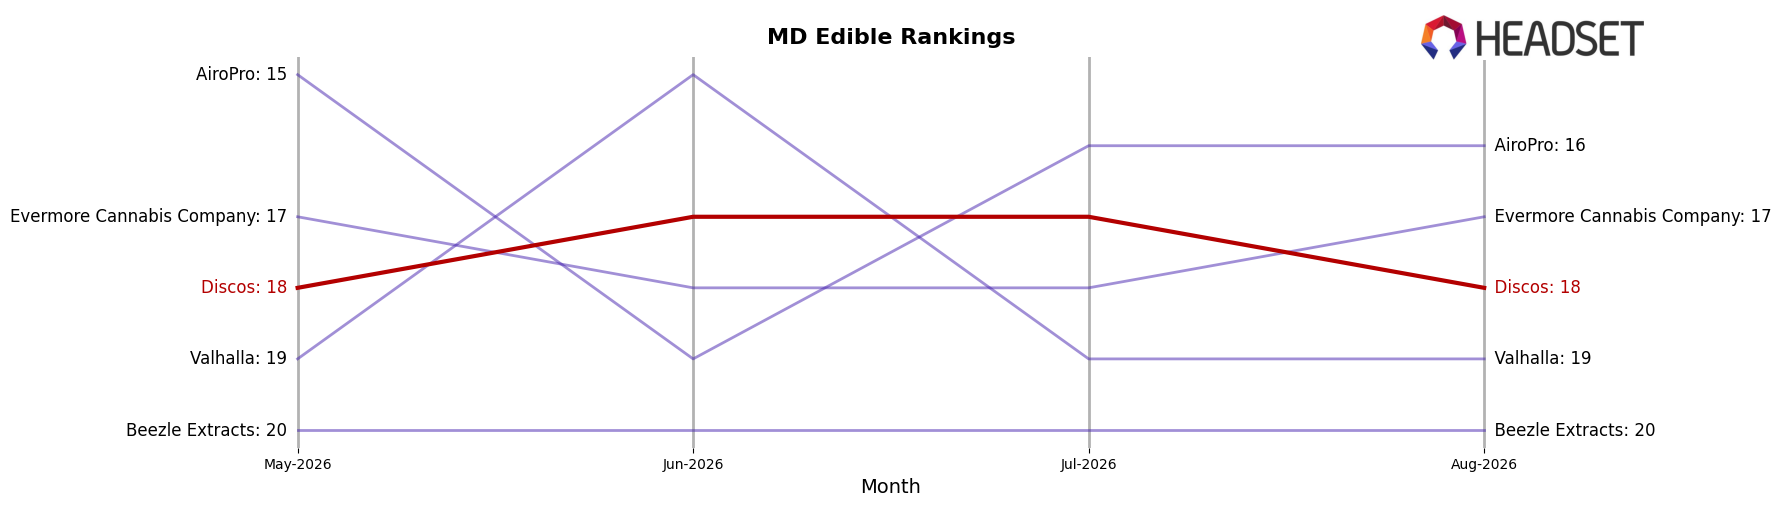
Discos sits at rank #18 in MD Edible for August 2026, improving 2 positions from #20 year over year, while holding flat versus three months ago at #18; the brand’s peak at #16 in April 2026 suggests recent gains have not yet reset its ceiling. Competitively, Incredibles climbed from #3 to #1 with a 46.3% YoY sales increase, and In House advanced from #6 to #3 on 44.9% YoY growth, whereas Wyld slid from #1 to #4 with a 28.7% YoY decline; these shifts indicate Discos’ modest +2 rank lift is occurring amid rapid upward movement at the top and notable pullbacks among prior leaders. The pattern implies that Discos’ trajectory—up 2 ranks YoY but capped below its #16 peak—positions it to benefit if churn among leaders persists, yet the absence of additional gains since April 2026 signals that breaking into the mid-teens will require outpacing competitors that are either accelerating upward or retrenching from earlier highs.
Notable Products
CBD/THC/CBC 8:1:1 Peach Blackberry Gummies 10-Pack (800mg CBD, 100mg THC, 100mg CBC) delivered the standout move in August 2026, surging 86.4% month over month to capture rank 1, while CBD/THC/CBN 5:1:1 Wild Cherries Gummies 10-Pack (500mg CBD, 100mg THC, 100mg CBN) slipped 13.2% to rank 2. Milk Chocolate Peanut Butter Cups 10-Pack (100mg) held rank 3 despite an 8.3% decline, and Sours Pink Lemonade Live Resin Gummies 10-Pack (100mg) fell 11.0% at rank 7, indicating formulation mixes with minor cannabinoids are gaining momentum against conventionals. With eight of the top ten SKUs in the Edible category and a single-gummy leader anchoring the ladder, the mix points to a pivot toward high-CBD and functional blends that prioritize differentiated effects over flavor extensions. The pattern implies Discos is consolidating around wellness-oriented gummies to drive share, with August 2026 growth concentrated in cannabinoid-complex SKUs rather than classic chocolates, supported by a top-line near $22,470.
Top Selling Cannabis Brands






Data for this report comes from real-time sales reporting by participating cannabis retailers via their point-of-sale systems, which are linked up with Headset’s business intelligence software. Headset’s data is very reliable, as it comes digitally direct from our partner retailers. However, the potential does exist for misreporting in the instance of duplicates, incorrectly classified products, inaccurate entry of products into point-of-sale systems, or even simple human error at the point of purchase. Thus, there is a slight margin of error to consider. Brands listed on this page are ranked in the top twenty within the market and product category by total retail sales volume.

