Jun-2026
Sales
Trend
6-Month
Product Count
SKUs
Avg Price
YoY Sales Change
YoY Price Change
Market Insights Snapshot
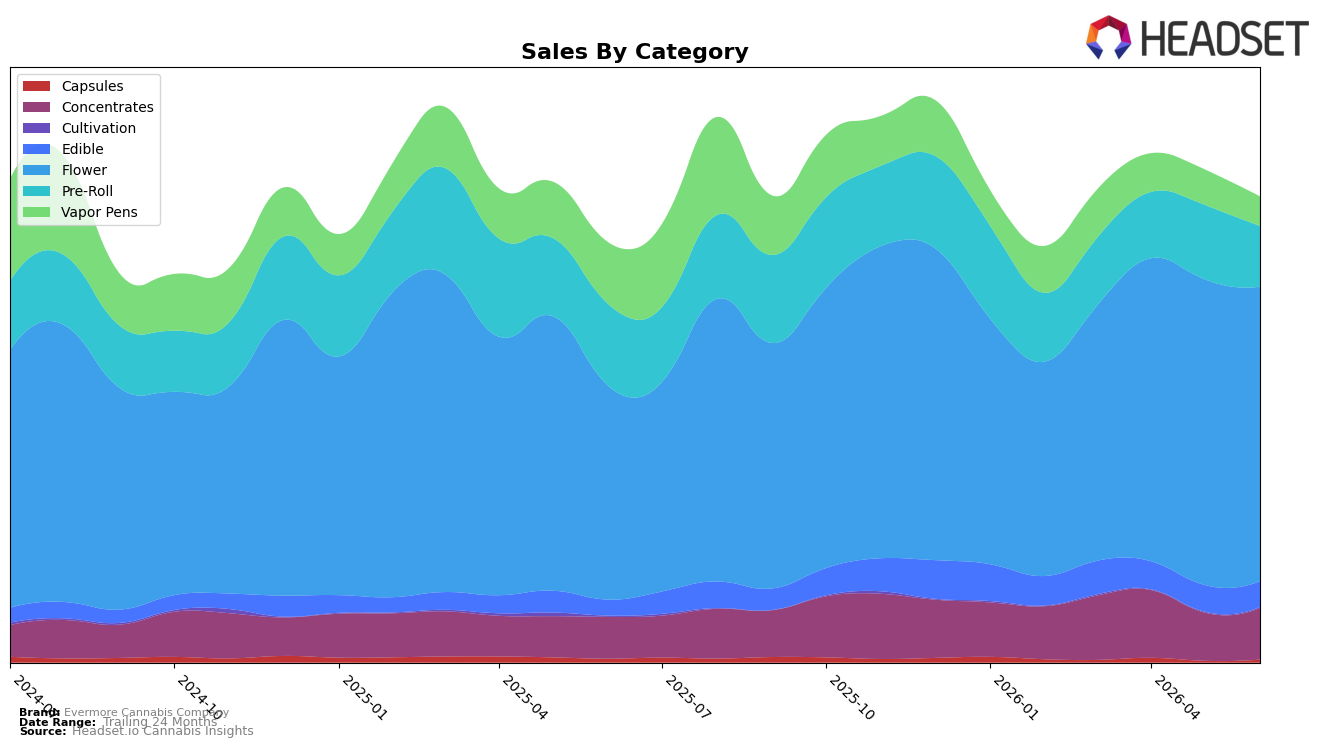
In June 2026, Evermore Cannabis Company concentrated 62.84% of sales in Flower with year-over-year growth of 37.55% but month-over-month decline of 3.67%, while holding rank 7 in Flower in Maryland. Pre-Roll contracted to a 13.09% share with a 25.40% YoY drop and an 18.22% MoM slide, contrasting with Concentrates at 11.15% share growing 23.17% YoY and 6.87% MoM. Edible expanded 58.18% YoY despite a 3.51% MoM dip and sits at a 5.64% mix share, whereas Vapor Pens fell 51.45% YoY and 16.16% MoM to 6.46% share. The portfolio-level picture is a tilt toward inhalables led by Flower and Concentrates, with June 2026 mix implying reliance on one leading category for scale and a complementary rebound in Concentrates to offset Pre-Roll and Vapor Pens softness.
The shift—Flower up 37.55% YoY at 62.84% share alongside Concentrates up 23.17% YoY—signals positioning around higher-THC inhalables, while the 51.45% YoY decline in Vapor Pens and 25.40% YoY decline in Pre-Roll indicate deprioritization or tightening in lower-price, convenience formats. With a 6.87% MoM lift in Concentrates against a 3.67% MoM dip in Flower, June 2026 suggests a gradual hedge within inhalables that can support margin at a $41.42 average Flower price and a $37.38 Concentrates price; combined with a 58.18% YoY rise in Edible, the mix points to a barbell positioning that relies on premium Flower for volume while cultivating growth adjacencies to stabilize share if rank 7 in Maryland Flower tightens.
Competitive Landscape
Evermore Cannabis Company ranks #7 in MD Flower in June 2026, improving 4 positions from #11 year over year, while slipping 2 places from #5 at its December 2025 peak; against the field, SunMed held at #1 year over year and RYTHM advanced from #3 to #2 with 42.7% YoY sales growth. The 2-rank rise from #9 three months ago to #7 now contrasts with Strane moving from #7 to #4 alongside 58.8% YoY growth, and District Cannabis holding flat at #5 with 14.9% YoY growth; this mix indicates Evermore Cannabis Company has regained share versus spring but is ceding ground to faster-accelerating peers, implying a stabilization phase rather than a return to its December 2025 peak trajectory.

Notable Products
The steepest decline came from Sunset Octane Pre-Roll 2-Pack (1g), dropping 43.7% month over month to rank 4, while Midnight Circus (3.5g) slid 11.2% at rank 6. In contrast, Sunset Octane (3.5g) climbed 42.1% to rank 2 and Rainbow Push Pop #4 (3.5g) rose 38.8% to hold rank 1, indicating demand concentrated in Flower as Pre-Roll weakens. With six of the top ten SKUs in Flower and Patapeake Shortbread (3.5g) adding a 17.6% lift at rank 10 against Funky Guava (3.5g) falling 32.1% at rank 9, the mix tilts toward fewer, faster-moving eighths rather than breadth in Pre-Roll. This pattern implies Evermore Cannabis Company is consolidating around flagship Flower strains and reducing reliance on Pre-Roll velocity despite $25,925 in June 2026 sales for the top Pre-Roll.
Top Selling Cannabis Brands
Data for this report comes from real-time sales reporting by participating cannabis retailers via their point-of-sale systems, which are linked up with Headset’s business intelligence software. Headset’s data is very reliable, as it comes digitally direct from our partner retailers. However, the potential does exist for misreporting in the instance of duplicates, incorrectly classified products, inaccurate entry of products into point-of-sale systems, or even simple human error at the point of purchase. Thus, there is a slight margin of error to consider. Brands listed on this page are ranked in the top twenty within the market and product category by total retail sales volume.

