Jun-2026
Sales
Trend
6-Month
Product Count
SKUs
Avg Price
YoY Sales Change
YoY Price Change
Market Insights Snapshot
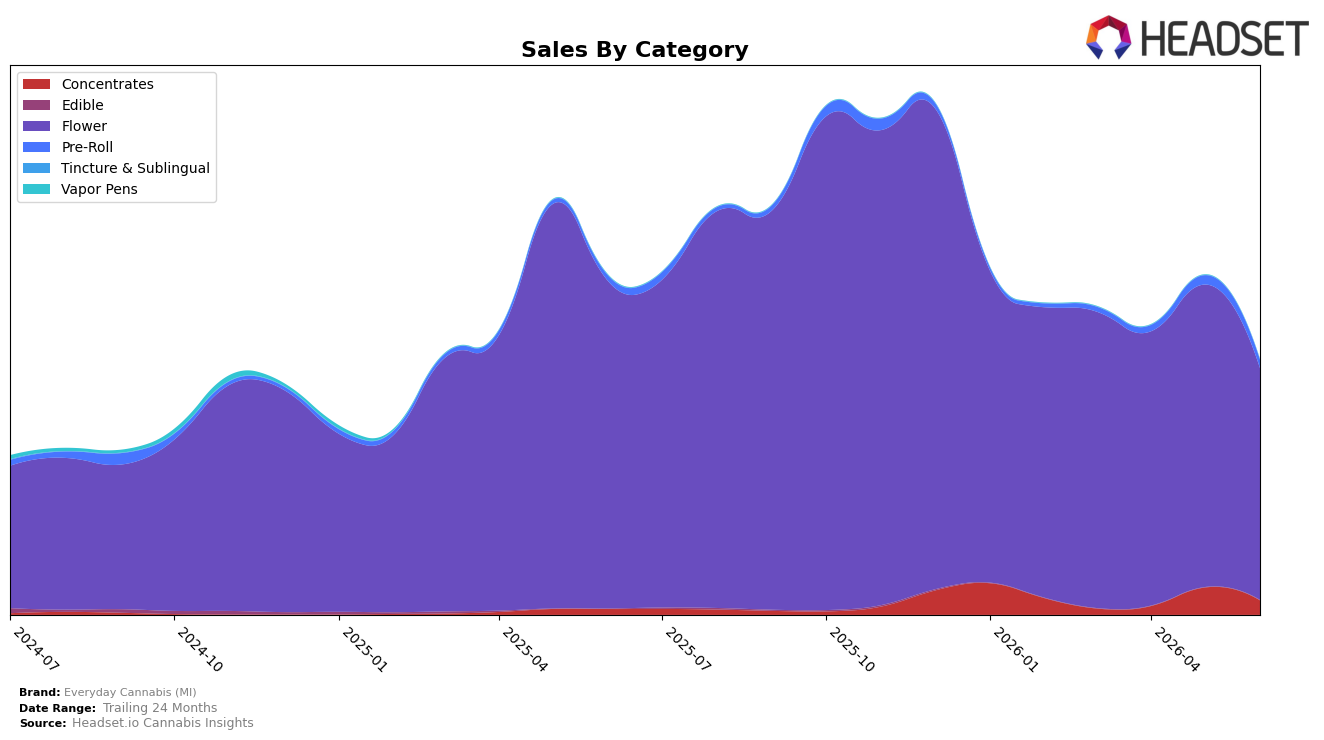
Everyday Cannabis (MI) concentrated 91.33% of June 2026 sales in Flower, down 29.19% year over year and 23.41% month over month, while Pre-Roll held 3.12% with 52.41% YoY growth but an 11.18% MoM decline; Concentrates represented 5.55% with 159.37% YoY growth but a 47.71% MoM drop. Despite a brand-level YoY sales decline of 24.97% and a 27.39% YoY increase in average price to $21.46, the category mix remains highly concentrated in Flower, implying that short-term volume contraction in a single category is amplifying total-brand volatility in Michigan.
With Flower at rank 9 in Michigan and holding over 90% mix while posting double-digit MoM decline (-23.41%) and large YoY contraction (-29.19%), the brand’s positioning is anchored in a weakening primary category that limits insulation from category-specific headwinds. The contrasting growth profiles—triple-digit YoY in Concentrates (159.37%) and double-digit YoY in Pre-Roll (52.41%) against concurrent MoM pullbacks (-47.71% and -11.18%, respectively)—suggest experimentation that has yet to translate into durable share shift, implying the brand needs sustained mix diversification away from Flower to stabilize rank and reduce sensitivity to single-category price and demand swings.
Competitive Landscape
Everyday Cannabis (MI) sits at rank #9 in MI Flower in June 2026, down 2 positions year over year from #7 and 3 spots below its March 2026 mark of #6, while also standing 8 places off its peak at #1 from November 2025; in contrast, High Minded holds #1 despite a -13.7% YoY sales change and Goodlyfe Farms advanced from #5 to #2 on +44.1% YoY sales, indicating that Everyday Cannabis (MI) lost relative momentum as faster-rising peers consolidated top-tier share, and the downward rank drift implies a need to counter accelerating competitor gains to avoid further slide.

Notable Products
Hashbar OG Pre-Roll (1g) posted the standout move in June 2026 with a 142% month-over-month surge to rank 1, while Sherb Cream Pie (28g) climbed to rank 2 on a 64% increase and Sherb Cream Pie (3.5g) advanced to rank 5 with a 76% lift. Sherb Cream Pie Pre-Roll (1g) added a 57% MoM gain at rank 3, and four of the top ten were Pre-Roll SKUs concentrated between ranks 1 and 9, implying Everyday Cannabis (MI) is tilting toward fast-turn Pre-Rolls to anchor traffic while leveraging Sherb-family Flower for basket size.
Top Selling Cannabis Brands
Data for this report comes from real-time sales reporting by participating cannabis retailers via their point-of-sale systems, which are linked up with Headset’s business intelligence software. Headset’s data is very reliable, as it comes digitally direct from our partner retailers. However, the potential does exist for misreporting in the instance of duplicates, incorrectly classified products, inaccurate entry of products into point-of-sale systems, or even simple human error at the point of purchase. Thus, there is a slight margin of error to consider. Brands listed on this page are ranked in the top twenty within the market and product category by total retail sales volume.

