.svg)


Where to Buy
Doobies is stocked at 168 licensed dispensaries across Michigan, Oregon, and 2 other states, 155 of them in Michigan, with the deepest coverage in New Buffalo, Detroit, Ann Arbor, Monroe, and Lansing. Search by ZIP code or city below to find the closest one, or filter by product type if you are after a specific format.
Market Insights Snapshot
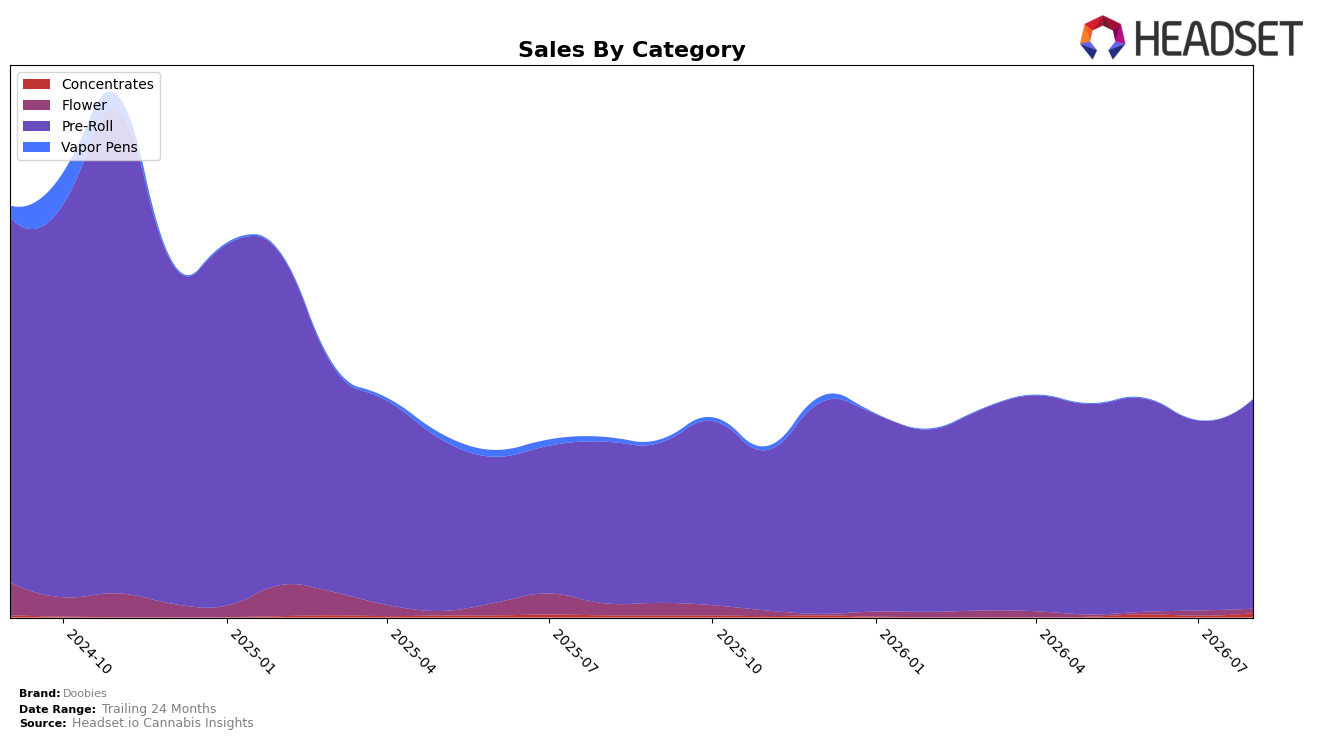
Doobies concentrated 96.36% of August 2026 sales in Pre-Roll, with the segment up 29.77% year over year and 10.30% month over month, while Concentrates lifted to a 1.83% share on 124.10% YoY and 183.33% MoM growth. Flower slipped to 1.80% share with a 66.37% YoY decline and a 17.47% MoM decline, and the average price fell 23.58% YoY to $2.16, indicating price-led volume in Pre-Roll rather than mix expansion from Flower. This mix and pricing trajectory implies Doobies is doubling down on value-oriented Pre-Roll growth while exiting higher-ticket Flower exposure, a posture aligned with rank 35 in Michigan Pre-Roll rather than a multi-category push.
The surge in Concentrates—up 183.33% MoM alongside a 124.10% YoY gain—against a concurrent 10.30% MoM rise in Pre-Roll suggests incremental trial rather than cannibalization, while Flower’s 66.37% YoY drop and 17.47% MoM drop point to deliberate pruning. With Pre-Roll holding 96.36% share and the brand’s overall sales up 21.32% YoY despite a 53.90% decline over 24 months, the current positioning leans toward defending and scaling a low-price Pre-Roll niche, using Concentrates as a small but accelerating adjacency to diversify risk without diluting the core.
Competitive Landscape
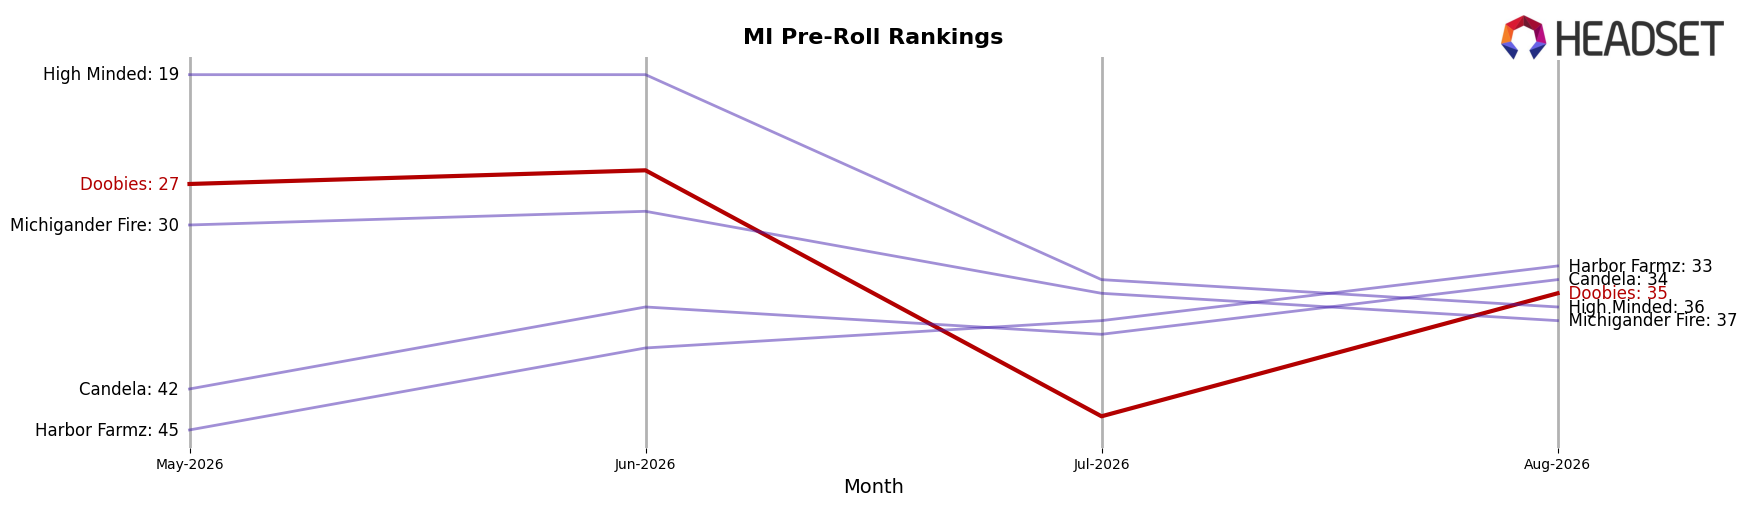
Doobies sits at rank #35 in MI Pre-Roll for August 2026, improving 14 positions from #49 year over year, but sliding 8 spots from #27 in May 2026, indicating short-term slippage despite a longer-term climb; the brand is also far from its peak at #8 in January 2025 and has not recovered that earlier position. Competitive movement suggests tightening at the top: Jeeter held #1 year over year while growing sales 3.1%, Pro Gro advanced from #9 to #4 with a 78.0% sales increase, and Goodlyfe Farms fell from #4 to #5 with a 41.1% sales decline, creating churn above Doobies without translating into share capture for it. The pattern implies Doobies’ rank trajectory is stabilizing at a mid-pack position—up 14 places YoY but down 8 sequentially—meaning future gains likely require outperforming fast risers like Pro Gro rather than waiting for top-tier attrition.
Notable Products
Thaiger King Pre-Roll (1g) posted the standout movement in August 2026 with a 94.9% month-over-month surge to rank 3, while White Runtz Pre-Roll (1g) fell 13.2% at rank 9 and CMAC OG Pre-Roll (1g) declined 16.5% at rank 10. AK 47 Pre-Roll (1g) held rank 1 and Mule Kick Pre-Roll (1g) advanced to rank 2 with a 47.5% lift, indicating gains are concentrated near the top while tail SKUs contract. Eight of the top ten are Pre-Roll SKUs from the same product family, and the spread between +94.9% growth and -16.5% decline within that family signals tightening SKU rationalization is warranted. The pattern implies Doobies is consolidating demand into a few high-velocity Pre-Roll leaders, pointing to a commercial shift toward depth behind winners rather than breadth across the lineup.
Top Selling Cannabis Brands






Data for this report comes from real-time sales reporting by participating cannabis retailers via their point-of-sale systems, which are linked up with Headset’s business intelligence software. Headset’s data is very reliable, as it comes digitally direct from our partner retailers. However, the potential does exist for misreporting in the instance of duplicates, incorrectly classified products, inaccurate entry of products into point-of-sale systems, or even simple human error at the point of purchase. Thus, there is a slight margin of error to consider. Brands listed on this page are ranked in the top twenty within the market and product category by total retail sales volume.

