.svg)


Where to Buy
Seed Junky Genetics is stocked at 592 licensed dispensaries across Michigan, California, and 3 other states, 338 of them in Michigan, with the deepest coverage in New Buffalo, Detroit, Monroe, Grand Rapids, and Ann Arbor. Search by ZIP code or city below to find the closest one, or filter by product type if you are after a specific format.
Market Insights Snapshot
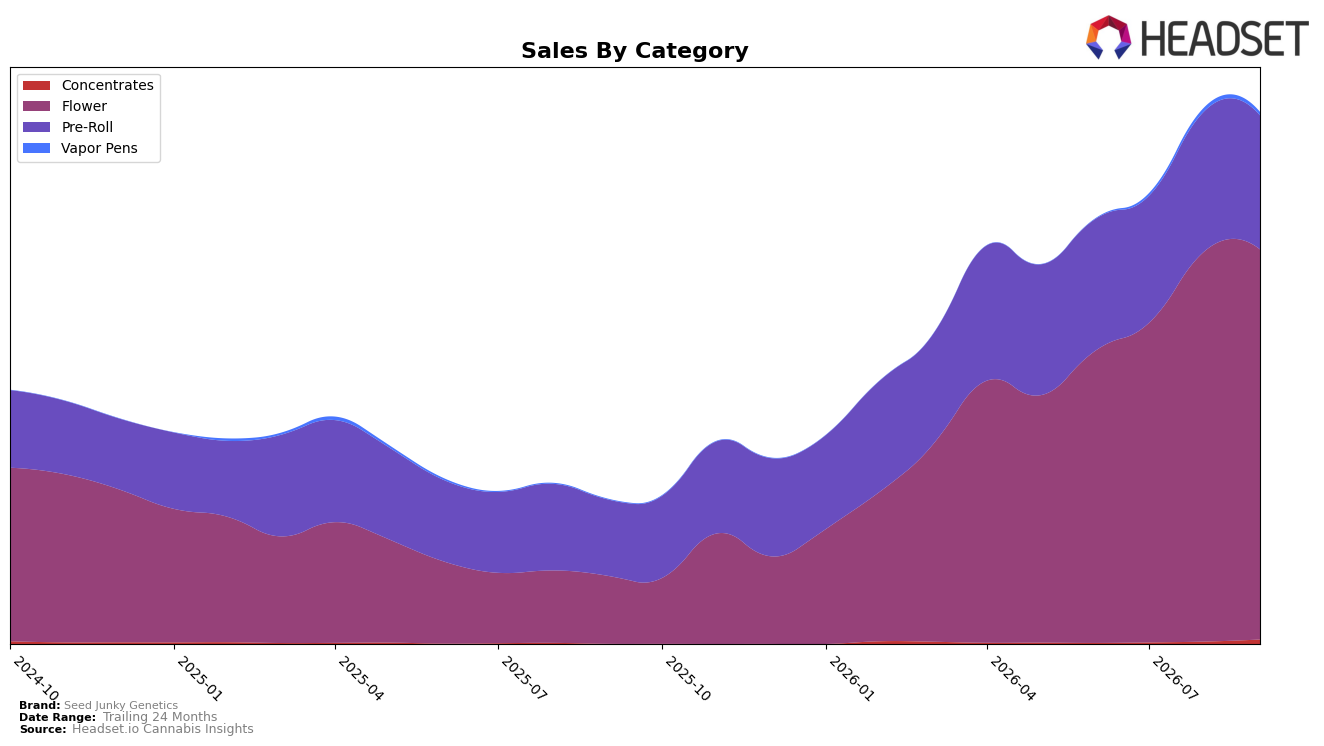
Seed Junky Genetics concentrated 73.40% of September 2026 sales in Flower, ranking 13 in California Flower, while Pre-Roll accounted for 25.18% and Concentrates and Vapor Pens together remained under 1.50%. Year over year, Flower expanded 477.31% as Pre-Roll rose 75.89%, yet month over month both contracted, with Flower down 0.08% and Pre-Roll down 4.46%; in contrast, Concentrates surged 2,516.99% YoY and 86.10% MoM while Vapor Pens climbed 606.48% YoY but slipped 13.24% MoM. With average price up 26.25% YoY alongside a category mix anchored in higher-ticket Flower (average price 27.32 versus brand average 16.93), the pattern implies margin-oriented mix control tempered by tactical pruning in Pre-Roll and Vapor Pens to protect price architecture.
The shift toward outsized YoY gains in niche formats (2,516.99% in Concentrates and 606.48% in Vapor Pens) alongside MoM pullbacks in three of four categories suggests deliberate pacing to defend Seed Junky Genetics’s September 2026 positioning as a Flower-led brand rather than chasing volatile volume. Holding a 73.40% Flower share while sitting at rank 13 in California indicates headroom if the brand gradually reallocates from Pre-Roll’s 25.18% toward high-velocity Flower and selectively scales Concentrates after an 86.10% MoM uptick; the mix implies a focus on premiumization and differentiated SKUs to climb ranks without overextending assortment breadth.
Competitive Landscape
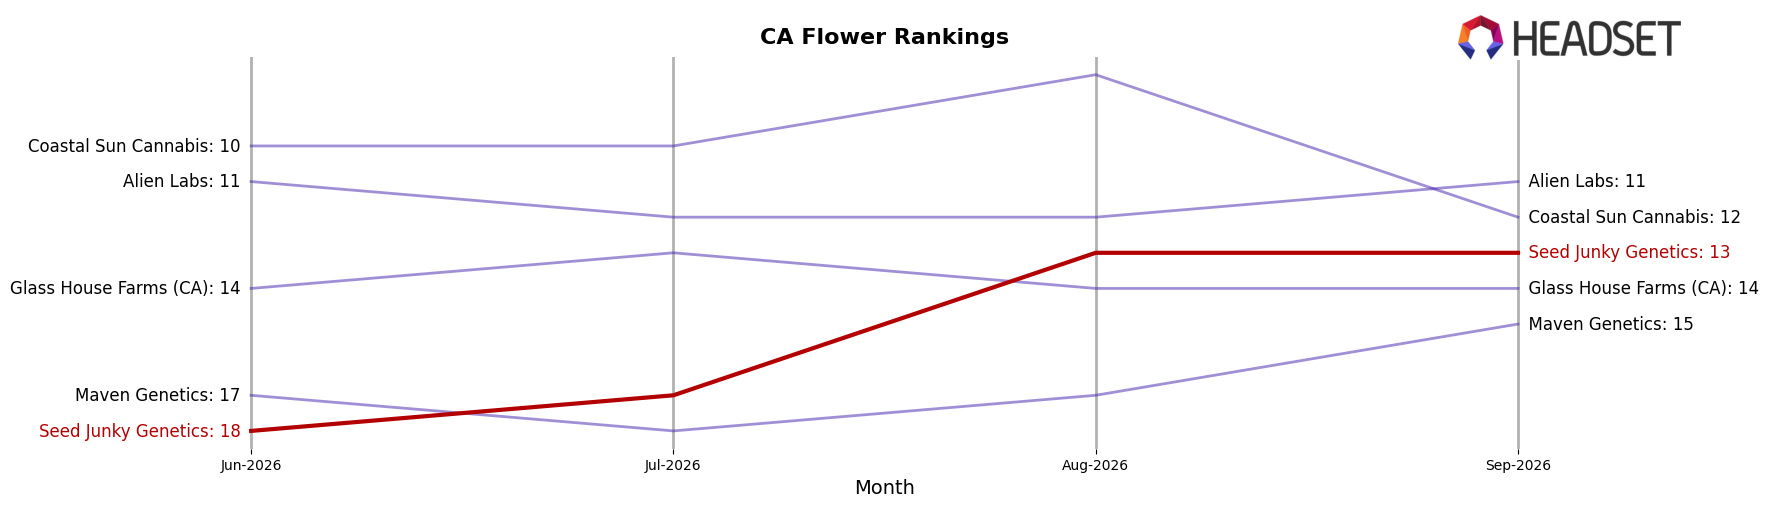
Seed Junky Genetics sits at rank #13 in CA Flower in September 2026 after climbing 71 positions year over year from #84, and it also improved 5 spots from June 2026 when it was #18; this September 2026 rank is its peak to date at #13. In contrast, STIIIZY moved from #2 to #1 with 47.8% year-over-year sales growth while CannaBiotix (CBX) slipped from #1 to #3 with a 21.1% year-over-year sales decline, and Oakfruitland advanced from #11 to #5 on 73.5% year-over-year sales growth; against this backdrop, Seed Junky Genetics’ rise from #84 to #13 alongside a three-month gain from #18 to #13 implies a momentum-driven repositioning toward the top tier that now requires sustained share capture to penetrate the top 10.
Notable Products
Red Eye Pre-Roll (1g) posted the largest move, up 93.1% month over month to rank 1, while Toad Venom Pre-Roll (1g) climbed 58.7% to rank 2, signaling a pivot toward inhalable convenience at the very top of the lineup. In contrast, Red Eye (3.5g) fell 31.8% and sits at rank 4, and Gello Shotz Pre-Roll (1g) declined 20.0% at rank 8, indicating volatility below the leaders. With six of the top ten coming from the Pre-Roll category and only one raw revenue anchor above $140,000 in Flower, the mix implies Seed Junky Genetics is consolidating momentum in higher-velocity Pre-Roll formats while de-emphasizing midshelf Flower exposure.
Top Selling Cannabis Brands






Data for this report comes from real-time sales reporting by participating cannabis retailers via their point-of-sale systems, which are linked up with Headset’s business intelligence software. Headset’s data is very reliable, as it comes digitally direct from our partner retailers. However, the potential does exist for misreporting in the instance of duplicates, incorrectly classified products, inaccurate entry of products into point-of-sale systems, or even simple human error at the point of purchase. Thus, there is a slight margin of error to consider. Brands listed on this page are ranked in the top twenty within the market and product category by total retail sales volume.

