Oct-2025
Sales
Trend
6-Month
Product Count
SKUs
Overview
Market Insights Snapshot
Dope Dope (NV) has shown varied performance across different categories in the state of Nevada. In the Edible category, the brand made its first appearance in the rankings in August 2025, debuting at 32nd place and subsequently improving to 28th position by September and October. This steady climb into and within the top 30 suggests a positive trend in consumer reception and market penetration for their edible products. However, the absence of a ranking in July indicates that they were not in the top 30 at that time, highlighting a significant improvement over the months. This upward movement could be attributed to strategic marketing efforts or product enhancements that resonated well with consumers.
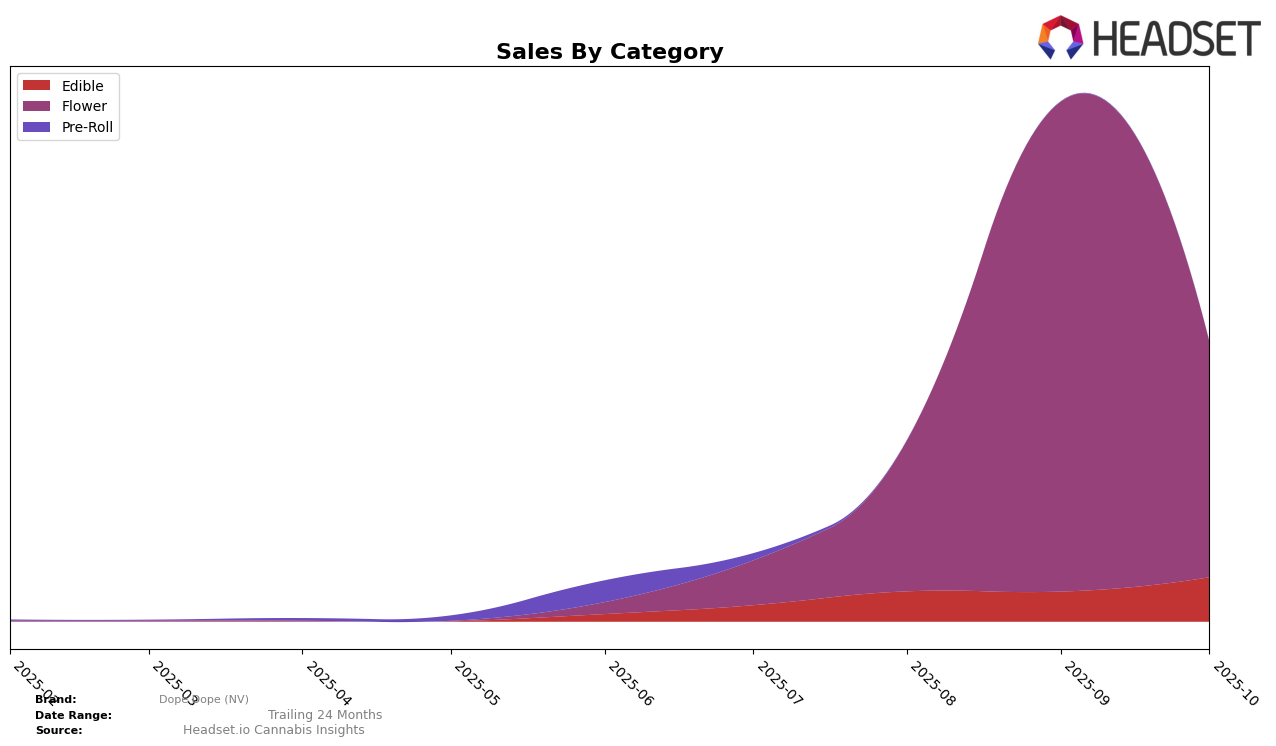
In the Flower category, Dope Dope (NV) experienced a fluctuating yet generally positive trajectory. The brand's rank improved significantly from 86th place in July to 31st in September, showcasing a remarkable surge in popularity and demand. However, by October, the ranking dipped slightly to 50th, which suggests a potential challenge in maintaining their position amid competitive pressures or shifting consumer preferences. Despite this, the brand's ability to break into the top 50 from a non-top 30 position earlier in the year indicates a strong performance in this category. The sales data also reflects a peak in September, suggesting that this period was particularly successful for their Flower products in Nevada.
Competitive Landscape
In the competitive landscape of the Nevada flower category, Dope Dope (NV) has experienced notable fluctuations in its market position over the past few months. Starting from a rank of 86 in July 2025, Dope Dope (NV) made a significant leap to 31 in September, before settling at 50 in October. This volatility is indicative of a dynamic market environment and suggests potential opportunities for growth if the brand can stabilize its performance. Competitors like Session (NV) have maintained a strong presence, although their rank dropped from 17 in July to 51 in October, hinting at potential vulnerabilities. Meanwhile, THC Design and Matrix NV have shown varying trends, with THC Design dropping from 36 to 46 and Matrix NV improving from 60 to 48 over the same period. These shifts highlight the competitive pressure and the need for Dope Dope (NV) to capitalize on its upward momentum from September to enhance its market share and sales performance.

Notable Products
In October 2025, the top-performing product for Dope Dope (NV) was Big Apple x Kush Mintz (7g) from the Flower category, securing the number 1 rank with sales of 1226 units. Georgia Pie (7g), also in the Flower category, improved its ranking from 3rd in September to 2nd in October, showing a significant sales increase to 1104 units. The Edible category's Strawberry Kiwi Party Rocks (10mg) maintained strong performance, ranking 3rd in October, up from 4th in September. Thin Mints x Jealousy (3.5g) dropped to 4th place in October, having previously held the 2nd spot in August. Rounding out the top five, Pineapple Orange Party Rocks (10mg) ranked 5th, demonstrating consistent performance despite fluctuating rankings in previous months.
Top Selling Cannabis Brands
Data for this report comes from real-time sales reporting by participating cannabis retailers via their point-of-sale systems, which are linked up with Headset’s business intelligence software. Headset’s data is very reliable, as it comes digitally direct from our partner retailers. However, the potential does exist for misreporting in the instance of duplicates, incorrectly classified products, inaccurate entry of products into point-of-sale systems, or even simple human error at the point of purchase. Thus, there is a slight margin of error to consider. Brands listed on this page are ranked in the top twenty within the market and product category by total retail sales volume.


