Jun-2026
Sales
Trend
6-Month
Product Count
SKUs
Avg Price
YoY Sales Change
YoY Price Change
Market Insights Snapshot
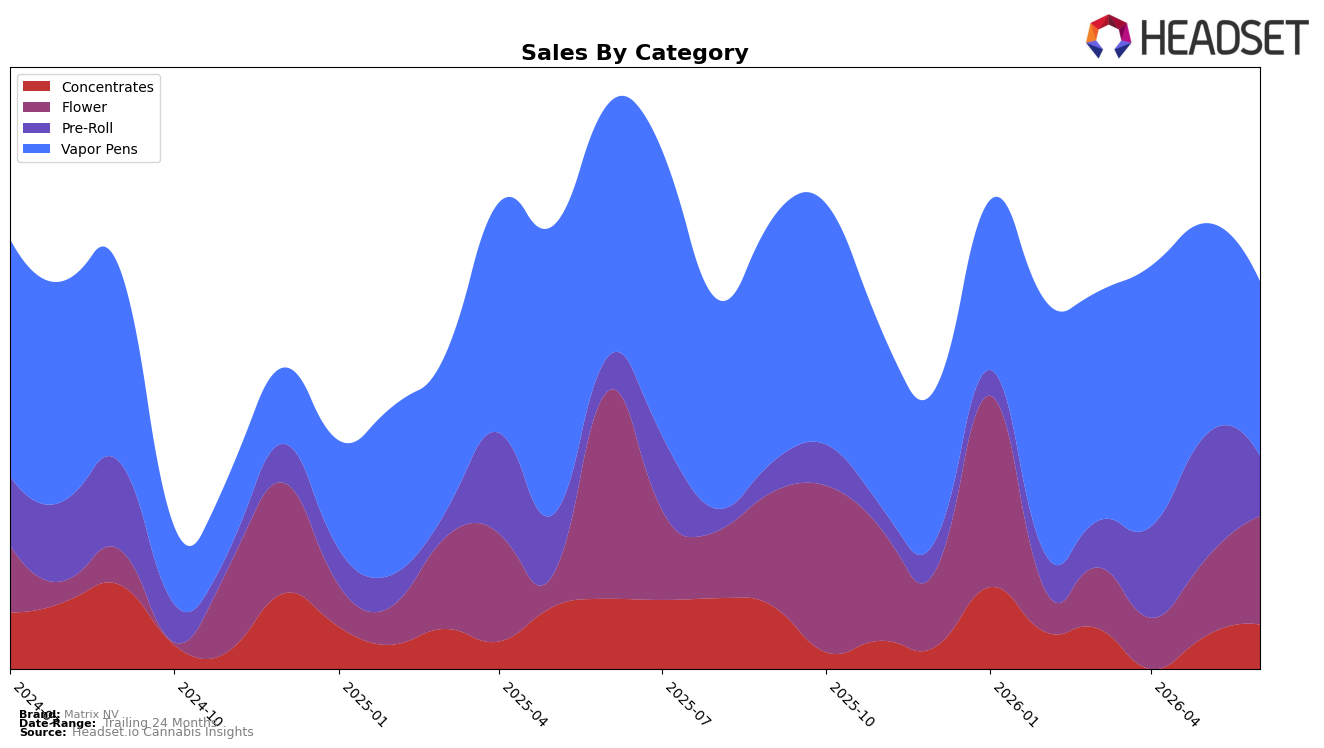
Matrix NV’s category mix in June 2026 tilts toward Vapor Pens at 40.47% share with a year-over-year decline of 27.75% and a month-over-month drop of 15.89%, while Flower holds 27.26% share with a 42.12% YoY contraction but a 30.81% MoM rebound. Pre-Roll accounts for 17.69% share with 41.22% YoY growth contrasted by a 41.89% MoM pullback, and Concentrates sit at 14.58% share with a 26.08% YoY decline alongside a 19.93% MoM rise. With the brand’s overall sales down 26.12% YoY and average price down 18.16% YoY to $21.61, the mix signals a pivot away from high-ticket Vapor Pens toward volume-sensitive formats, implying a price-led repositioning in Nevada.
These shifts imply Matrix NV is recalibrating its position: the Vapor Pens anchor shows pressure at rank 23 in Nevada concurrent with a 27.75% YoY category decline and a 15.89% MoM dip, while Pre-Roll’s 41.22% YoY gain but 41.89% MoM drop suggests promotional or inventory-driven volatility rather than steady penetration. Flower’s 30.81% MoM lift despite a 42.12% YoY fall, and Concentrates’ 19.93% MoM rise amid a 26.08% YoY slide, point to near-term recapture of basket share, implying Matrix NV can defend relevance by leaning into recently recovering Flower and Concentrates while reducing reliance on Vapor Pens where momentum and rank have softened.
Competitive Landscape
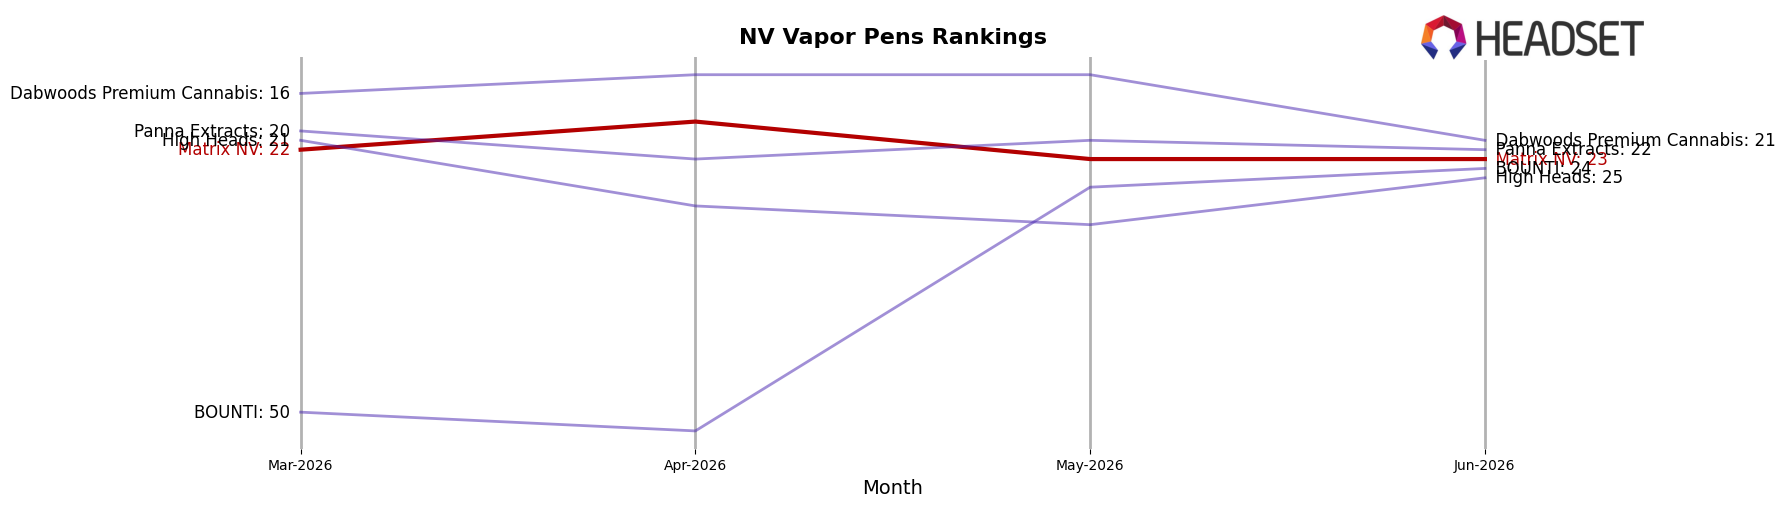
Matrix NV sits at rank #23 in NV Vapor Pens in June 2026, a 1-position improvement from #24 year over year but a 1-position slip from #22 three months ago; the brand’s peak was #19 in April 2026 and it is now 4 spots below that high. Against leading rivals, Rove holds #1 after moving up from #2 while posting a -19.3% YoY sales change, and STIIIZY slid from #1 to #2 with a -28.9% YoY sales change, indicating that Matrix NV’s marginal rank gain came amid top-tier softness; meanwhile, AiroPro advanced from #12 to #5 on an 82.9% YoY sales increase, implying competitive pressure is intensifying from fast-rising mid-tier players. The pattern implies Matrix NV’s slight YoY rank uptick is fragile: without momentum back toward the April 2026 peak, the brand risks being outpaced by ascending competitors even as category leaders retrench.
Notable Products
Banana Cream Sundae Pre-Roll (1g) posted the steepest decline in June 2026 at -75.1% and slid to rank 6, while Sugar Tits Pre-Roll (1g) fell -53.1% yet held rank 1; this divergence implies price or inventory strain is compressing momentum in pre-rolls unevenly across lead SKUs. Dupree's Diamonds Pre-Roll (1g) also contracted -28.8% at rank 3, and with six of the top ten coming from the Pre-Roll category despite two double-digit drops and one single-digit gain (+6.5% at rank 9), the concentration signals category reliance even as volatility rises. With Flower holding three top-10 slots and Vapor Pens one, the mix suggests Matrix NV is over-indexed to Pre-Roll traffic and may need Flower and Vapor Pens to shoulder growth as pre-rolls retrench.
Top Selling Cannabis Brands
Data for this report comes from real-time sales reporting by participating cannabis retailers via their point-of-sale systems, which are linked up with Headset’s business intelligence software. Headset’s data is very reliable, as it comes digitally direct from our partner retailers. However, the potential does exist for misreporting in the instance of duplicates, incorrectly classified products, inaccurate entry of products into point-of-sale systems, or even simple human error at the point of purchase. Thus, there is a slight margin of error to consider. Brands listed on this page are ranked in the top twenty within the market and product category by total retail sales volume.

