Oct-2025
Sales
Trend
6-Month
Product Count
SKUs
Avg Price
YoY Sales Change
YoY Price Change
Market Insights Snapshot
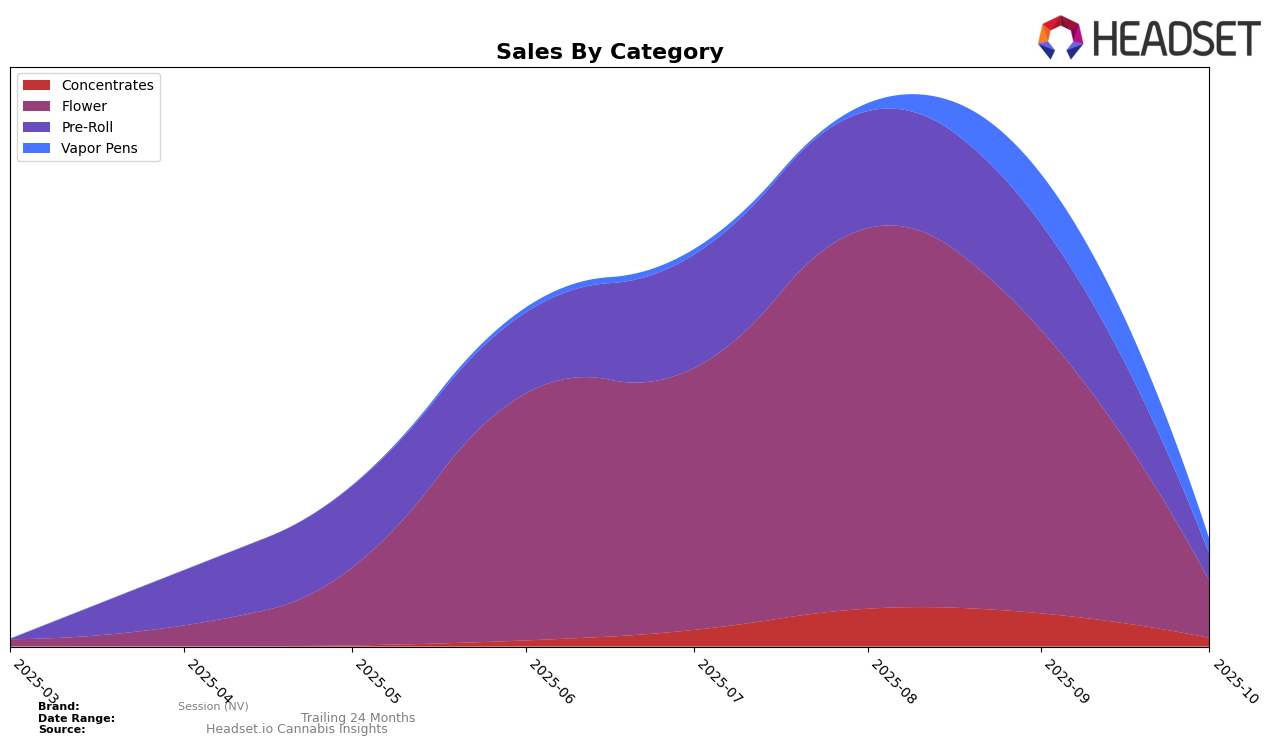
Session (NV) has shown a dynamic performance across various product categories in the state of Nevada. In the Concentrates category, the brand experienced a notable rise from 21st place in July 2025 to 11th in August, but saw a decline to 27th by October. This fluctuation suggests a volatile market presence, possibly influenced by seasonal demand or competitive pressures. In the Flower category, Session (NV) initially held a strong position, ranking 17th in July and improving to 11th in August. However, by October, the brand had dropped out of the top 30, indicating a significant shift in consumer preferences or competitive dynamics.
In the Pre-Roll category, Session (NV) maintained a relatively stable position, ranking 11th in July and August, but dropping to 38th by October. This decline could reflect increased competition or changing consumer trends in Nevada. Meanwhile, the Vapor Pens category saw a gradual improvement, with the brand entering the top 30 in September at 27th, despite not ranking in July. However, by October, the rank had decreased to 43rd, suggesting challenges in sustaining market momentum. These movements across categories highlight the brand's varying performance and the competitive landscape in the Nevada cannabis market.
Competitive Landscape
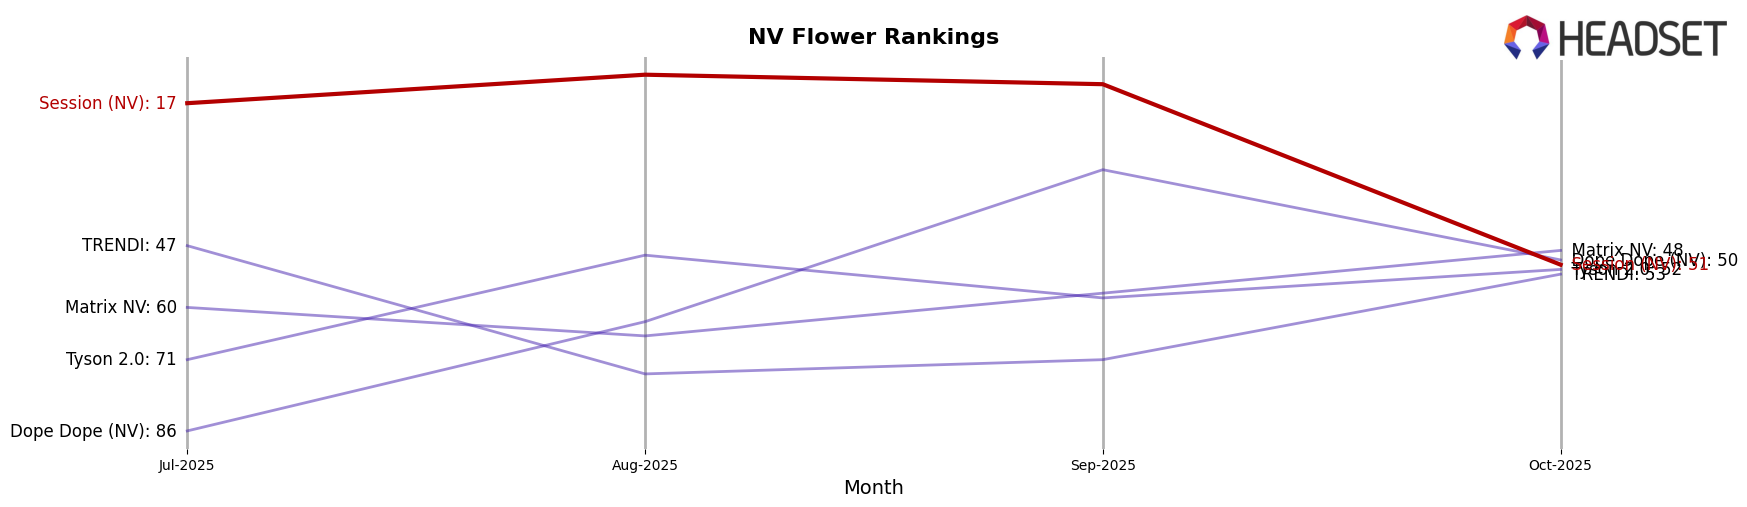
In the competitive landscape of the Nevada flower category, Session (NV) has experienced significant fluctuations in its market position from July to October 2025. Initially holding a strong position at rank 17 in July, Session (NV) improved to rank 11 in August, indicating a positive reception and increased sales momentum. However, by October, the brand experienced a notable decline, dropping to rank 51, which suggests a substantial decrease in market share and sales. This decline is particularly striking when compared to competitors such as Matrix NV, which improved its rank from 60 to 48, and Tyson 2.0, which maintained a relatively stable position around the 50s. Meanwhile, Dope Dope (NV) exhibited a dramatic rise from rank 86 in July to 31 in September before settling at 50 in October, showcasing a volatile yet upward trend. These shifts highlight the competitive pressures Session (NV) faces and underscore the importance of strategic adjustments to regain its earlier market standing.
Notable Products
In October 2025, the top-performing product for Session (NV) was Modified Banana Pre-Roll (0.6g) in the Pre-Roll category, maintaining its number one rank with a notable sales figure of 1,702 units. Cadillac Fuel Hash Infused Pre-Roll (0.6g) emerged as the second-ranked product, making its debut in the rankings. Bert's Cake Infused Pre-Roll (0.6g) secured the third position, also appearing for the first time. Devil Driver Pre-Roll (0.6g) improved its ranking to fourth place from its previous absence in September. Legend OG (7g) entered the list at fifth place, indicating a strong performance in the Flower category.
Top Selling Cannabis Brands
Data for this report comes from real-time sales reporting by participating cannabis retailers via their point-of-sale systems, which are linked up with Headset’s business intelligence software. Headset’s data is very reliable, as it comes digitally direct from our partner retailers. However, the potential does exist for misreporting in the instance of duplicates, incorrectly classified products, inaccurate entry of products into point-of-sale systems, or even simple human error at the point of purchase. Thus, there is a slight margin of error to consider. Brands listed on this page are ranked in the top twenty within the market and product category by total retail sales volume.

