Jun-2026
Sales
Trend
6-Month
Product Count
SKUs
Avg Price
YoY Sales Change
YoY Price Change
Market Insights Snapshot
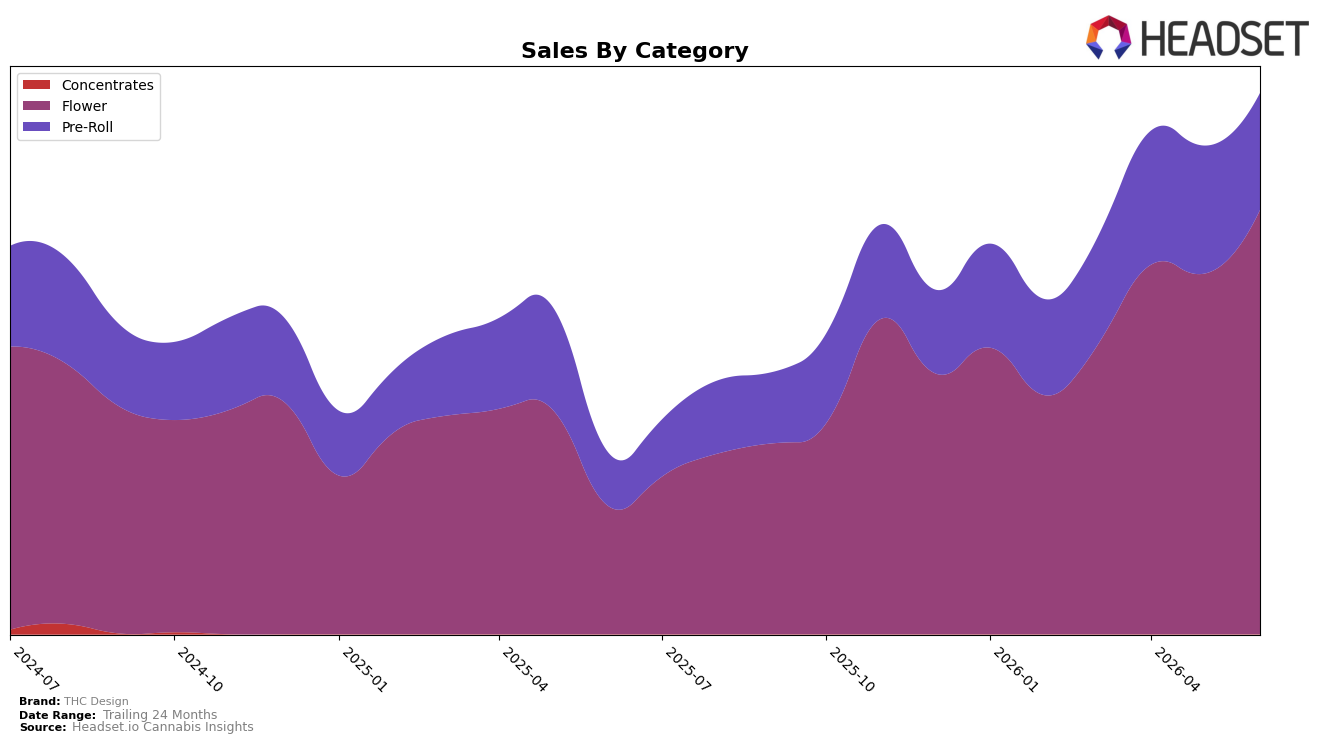
THC Design concentrated 78.42% of June 2026 sales in Flower, up 17.63% month over month and 231.50% year over year, while Pre-Roll held 21.58% share with an 8.58% month-over-month decline alongside 119.41% year-over-year growth. Average price fell 1.02% year over year to $26.92 even as total brand sales rose 198.58% year over year, and within the mix, Flower carried a higher average price at $36.56 versus Pre-Roll at $13.74. The pattern implies THC Design is leaning into higher-ticket Flower volume expansion to power growth, while accepting price deflation at the brand level to sustain velocity.
With Flower’s share nearing four-fifths and ranking 15th in Flower in Nevada, THC Design’s month-over-month gain of 17.63% in Flower alongside an 8.58% Pre-Roll contraction indicates prioritization of core SKUs that move the rank ceiling upward. The 231.50% year-over-year surge in Flower versus 119.41% in Pre-Roll, paired with a 1.02% brand-level price decline, implies a scale strategy centered on depth in Flower to improve shelf productivity and rank positioning in key Flower-led markets like CA, while trimming exposure to slower-turning Pre-Roll configurations.
Competitive Landscape
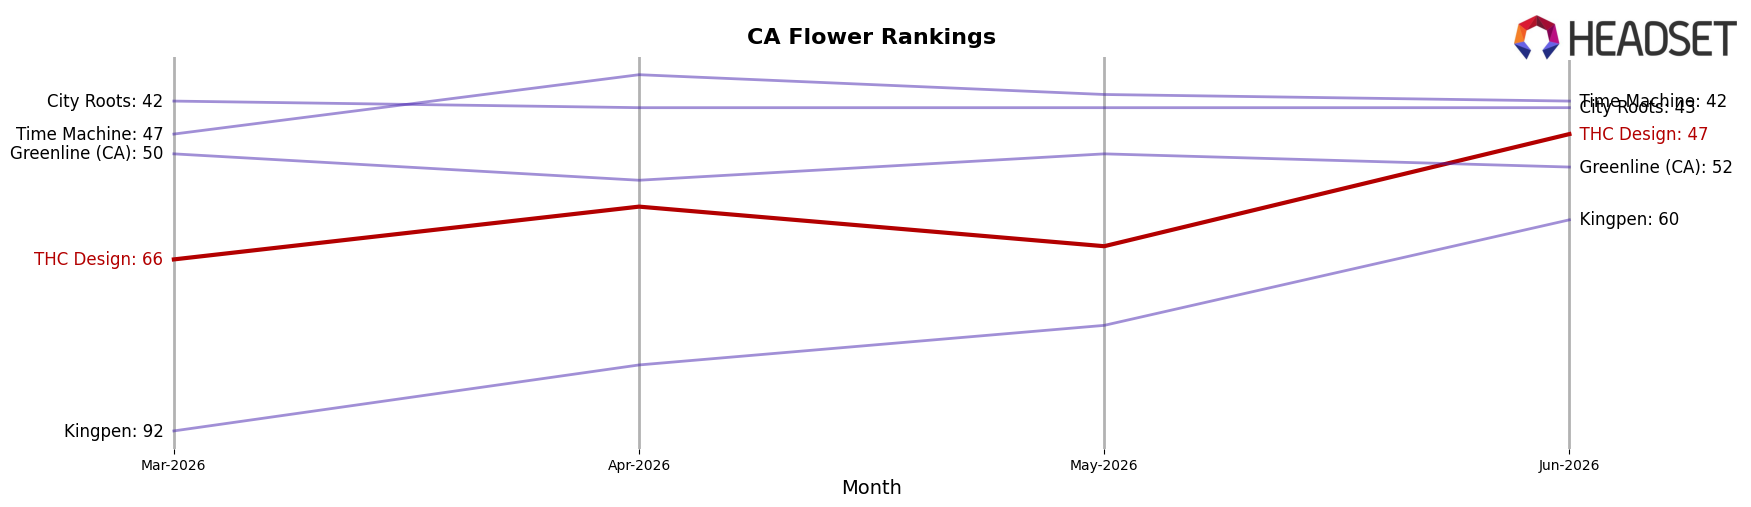
In June 2026, THC Design sits at rank #47 in CA Flower, improving 63 positions year over year from #110, and moving up 19 spots since March 2026 when it was #66; this follows a prior peak at #38 in June 2024, indicating recovery rather than new highs. Meanwhile, STIIIZY moved from #2 to #1 with sales up 62.5% year over year, and CAM climbed from #3 to #2 with sales up 56.2%, positioning category leaders further ahead as THC Design’s rise is off a lower base. The pattern implies THC Design’s current trajectory is one of mid-tier re-entry—gaining share rank quickly but still needing additional momentum to close the gap with top-three incumbents.
Notable Products
Garlic Cocktail (3.5g) delivered the standout move in June 2026 with a 78.3% month-over-month surge to rank 3, while Crescendo (3.5g) fell 21.3% yet held rank 1, indicating share is consolidating around a rising secondary Flower SKU even as the flagship softens. El Chivo Pre-Roll (1g) dropped 22.8% at rank 4 versus a 34.4% gain for Super Lemon Haze Pre-Roll (1g) at rank 6, and four of the top ten are Pre-Roll SKUs, signaling a split performance where singles face pressure while select strains rebound. With Crescendo Pre-Roll (1g) down 4.2% at rank 2 against Garlic Cocktail Pre-Roll (1g) down 19.0% at rank 8, the pattern points to strain-led preference shifts rather than a category-wide dip. The mix implies THC Design is leaning into Flower-led strain momentum while rationalizing Pre-Roll depth, using Garlic Cocktail’s acceleration to offset vulnerability in Crescendo and stabilize rank positions.
Top Selling Cannabis Brands
Data for this report comes from real-time sales reporting by participating cannabis retailers via their point-of-sale systems, which are linked up with Headset’s business intelligence software. Headset’s data is very reliable, as it comes digitally direct from our partner retailers. However, the potential does exist for misreporting in the instance of duplicates, incorrectly classified products, inaccurate entry of products into point-of-sale systems, or even simple human error at the point of purchase. Thus, there is a slight margin of error to consider. Brands listed on this page are ranked in the top twenty within the market and product category by total retail sales volume.

