Market Insights Snapshot
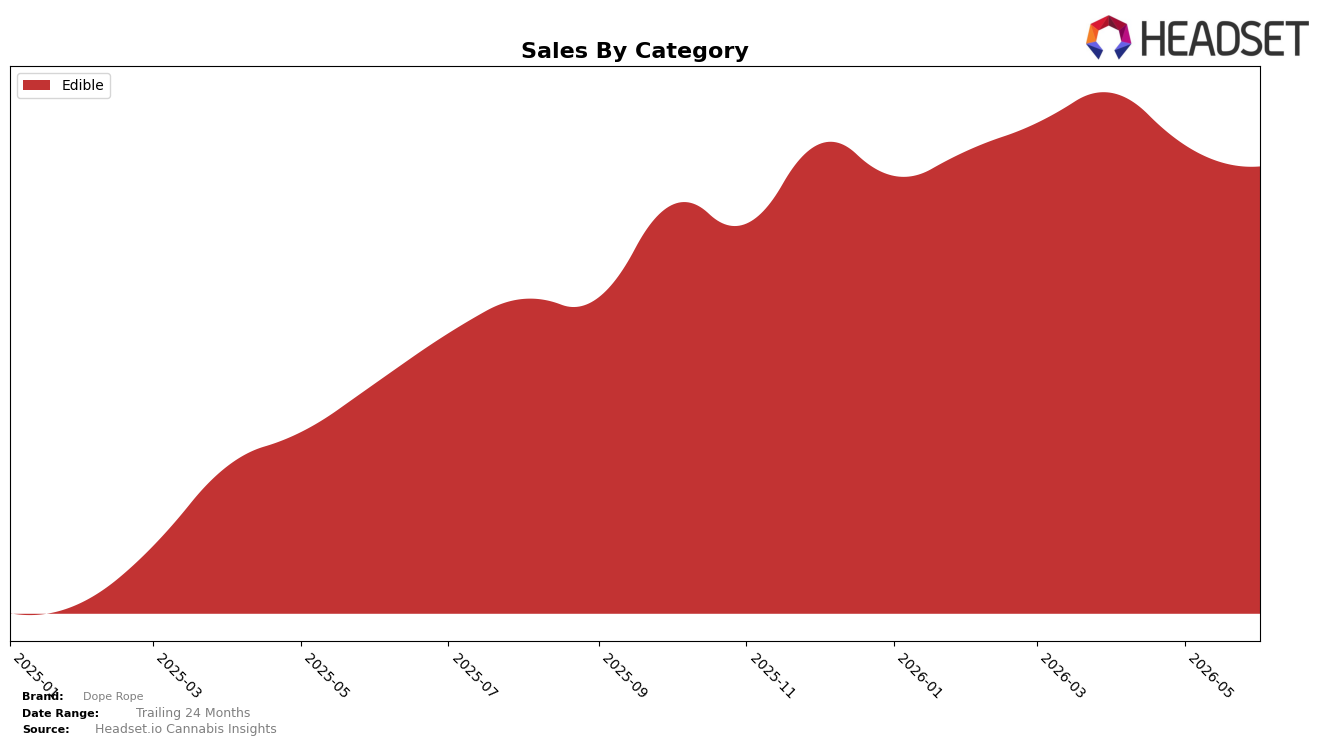
In June 2026, Dope Rope remained a single-category brand with Edible accounting for 100.0% of sales and holding a category rank of 13 in Michigan; the YoY sales growth of 92.9% contrasted with a MoM dip of 4.5%, while average price rose 2.6% YoY alongside a full-category concentration that left no buffer from other segments. The pattern of high YoY and negative MoM within a 100% Edible mix implies seasonality or promo normalization is pressuring monthly momentum even as annual demand expands, meaning the brand’s unit economics are nudging up on price but volume volatility remains tied to a single Edible cycle.
The combination of a 13th-place Edible rank in Michigan and a 100.0% reliance on Edible, with prices up 2.6% YoY against a 4.5% MoM sales decline, implies mid-pack positioning that is sensitive to short-term swings but accumulating share over longer horizons. This concentration, paired with 92.9% YoY growth, suggests the brand’s positioning leans on value-frequency Edible formats where incremental price tolerance exists, yet the absence of category diversification raises exposure to monthly downticks and signals that sustained rank gains will likely require either deeper Edible penetration or selective expansion to smooth MoM variability.
Competitive Landscape
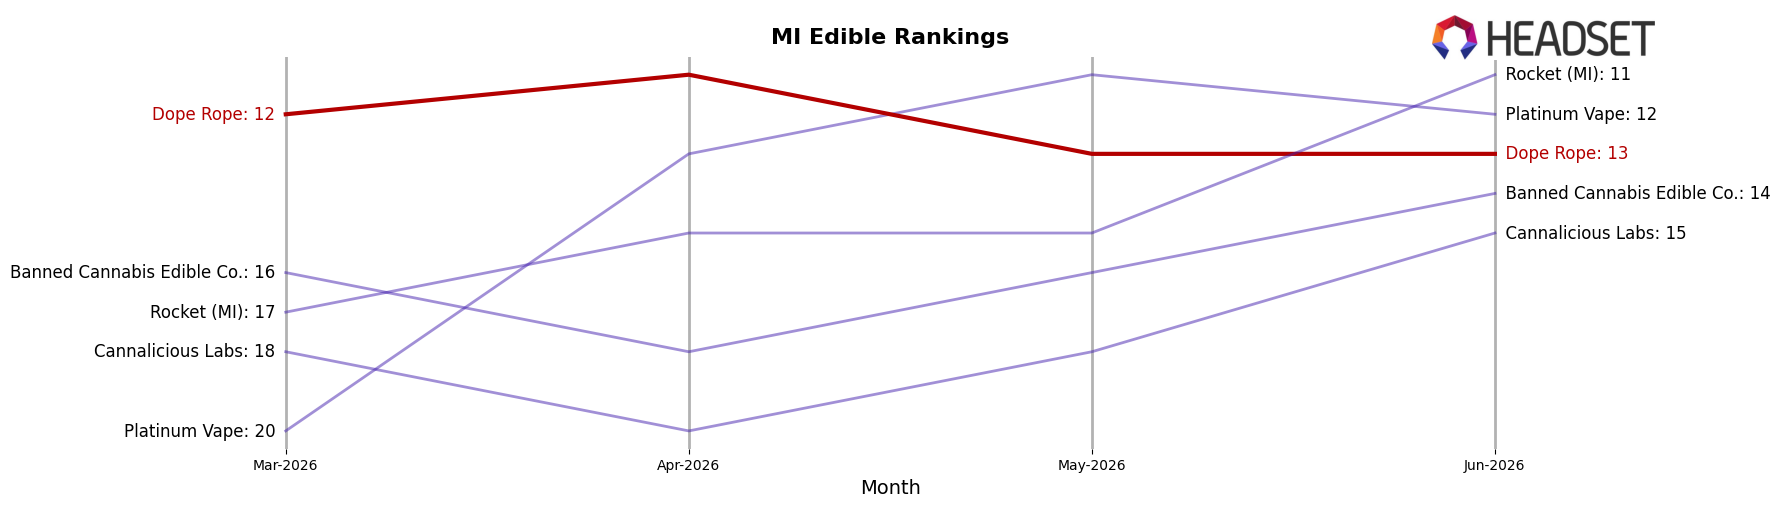
Dope Rope sits at rank #13 in MI Edible for June 2026, a 13-place climb from #26 year over year, but it slipped 1 spot from #12 in March 2026 and remains 2 places below its peak at #11 in April 2026; by contrast, Wyld held #1 both this year and last despite a -13.4% YoY sales change, while MKX Oil Company stayed at #3 with +10.8% YoY sales, indicating Dope Rope’s rank gains are driven more by relative reshuffling than absolute category expansion. With Choice static at #2 amid a -1.8% YoY sales dip and Good Tide sliding from #4 to #5 on -16.2% YoY sales, Dope Rope’s year-over-year rise of 13 ranks alongside a near-term drift from #12 to #13 suggests a consolidation phase where holding low-teens position is feasible, but breaking into the top 10 will require outpacing competitors whose rank stability persists despite mixed sales trends.
Notable Products
Maui Mango Gummy Rope (200mg) set the tone in June 2026 with a -14.1% month-over-month decline at rank 4 while Cherry Fizz Gummy Rope (200mg) fell -11.5% at rank 2, indicating erosion inside the core lineup rather than a single outlier dip. In contrast, Tarty Party Gummy Rope (200mg) climbed +29.8% to rank 6 and Sour Apple Smash Gummy Rope (200mg) rose +23.8% to hold rank 1, creating a split where momentum concentrates in just two SKUs as three others in the top 10 slid more than -11%. Eight of the top ten are Edible gummy ropes, and the concentration suggests Dope Rope is leaning into a flavor-rotation strategy that tolerates sharper declines in mid-pack SKUs to keep a smaller set of leaders accelerating, with category depth insulating overall rank positions despite uneven month-over-month swings.
Top Selling Cannabis Brands
Data for this report comes from real-time sales reporting by participating cannabis retailers via their point-of-sale systems, which are linked up with Headset’s business intelligence software. Headset’s data is very reliable, as it comes digitally direct from our partner retailers. However, the potential does exist for misreporting in the instance of duplicates, incorrectly classified products, inaccurate entry of products into point-of-sale systems, or even simple human error at the point of purchase. Thus, there is a slight margin of error to consider. Brands listed on this page are ranked in the top twenty within the market and product category by total retail sales volume.

