.svg)
Sep-2026
Sales
Trend
6-Month
Product Count
SKUs
Avg Price
YoY Sales Change
YoY Price Change


Where to Buy
PC Pure is stocked at 143 licensed dispensaries across Michigan, with the deepest coverage in New Buffalo, Detroit, Grand Rapids, Ann Arbor, and Sturgis. Search by ZIP code or city below to find the closest one, or filter by product type if you are after a specific format.
Market Insights Snapshot
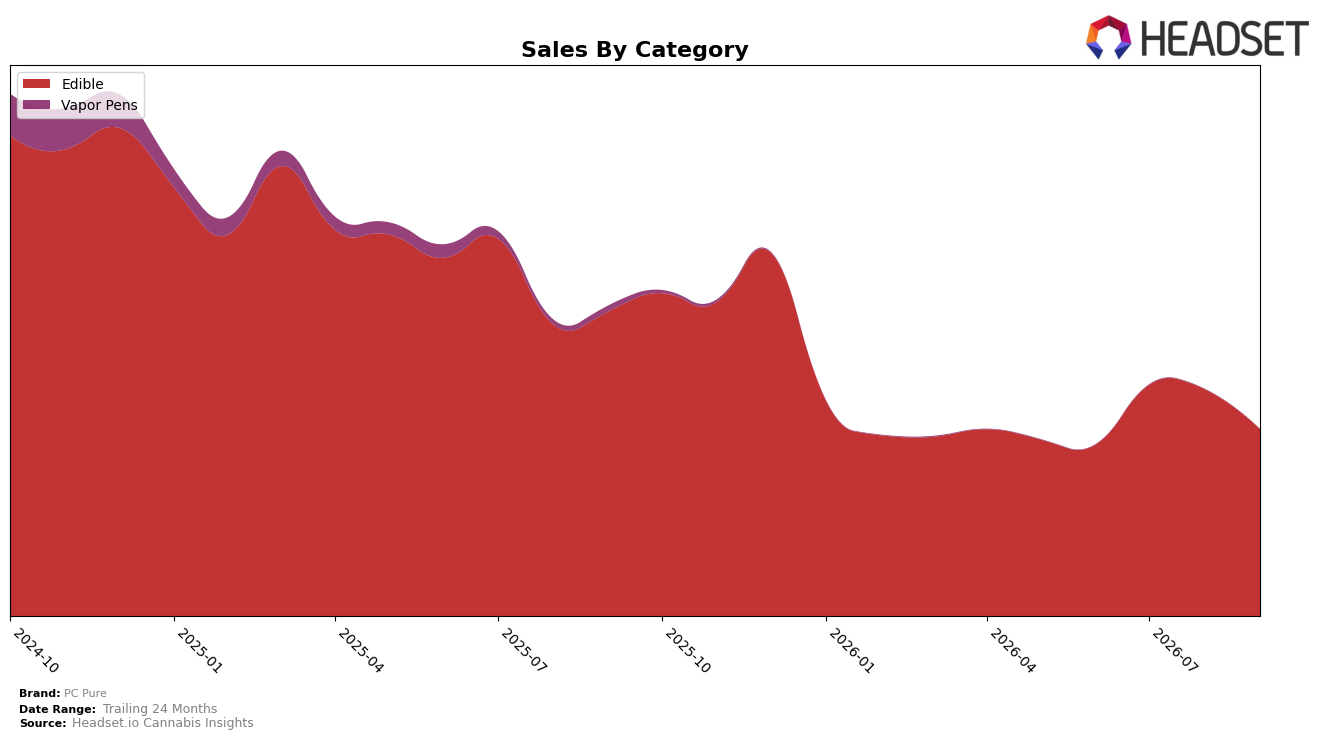
In September 2026, PC Pure operated as a single-category brand with Edible accounting for 100.0% of sales, while the category’s own trajectory slipped by -38.67% year over year and -17.70% month over month; that isolation magnifies exposure to Edible-specific volatility rather than cushioning it through cross-category offsets. Brand-wide sales declined -39.80% year over year against an 8.37% increase in average price, indicating volume contraction outpacing any price lift; on a longer arc, the -65.50% change versus 24 months reinforces that the contraction is not a one-month aberration. With Michigan rank at 34 in Edible and the top market concentrated in Michigan, the pattern implies PC Pure’s current mix anchors the brand to a mid-pack position that is highly sensitive to category headwinds and periodic price-driven elasticity.
The combination of a sole-category footprint at 100.0% Edible share and a -17.70% month-over-month downswing in September 2026, alongside a -38.67% year-over-year category result, implies PC Pure’s short-term positioning relies on defending frequency and pack-size architecture rather than expanding into adjacent formats. The 8.37% average price increase with a concurrent -39.80% brand sales decline suggests price elasticity is biting harder than trade-up behavior, and the rank of 34 in Michigan signals limited shelf velocity headroom without either mix diversification or targeted price/size resets; taken together, the pattern implies that stabilizing share will depend more on tactical price-pack architecture in Edible than on broad-based premiumization in the near term.
Competitive Landscape
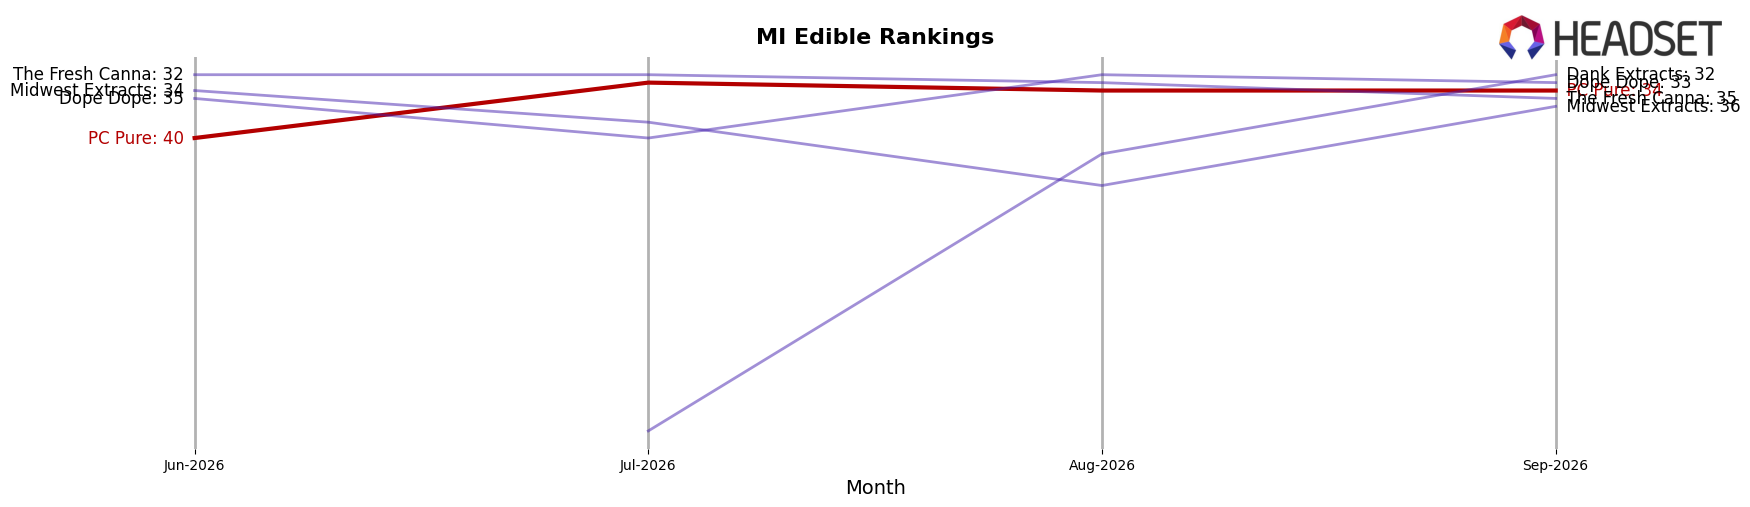
PC Pure sits at rank #34 in MI Edible in September 2026, down 12 positions year over year from #22, while improving 6 spots since June 2026 from #40, and its peak rank of #16 in September 2024 frames a two-year slide; against this backdrop, Wyld held #1 year over year and in September 2026 despite a -18.3% YoY sales change, and Rocket (MI) climbed from #14 to #5 alongside +65.2% YoY sales, indicating PC Pure is losing share to faster risers even as top incumbents with negative growth defend higher ranks—implying the current rank trajectory points to sustained competitive displacement unless the brand reclaims momentum seen at #16 in September 2024.
Notable Products
Orange Sherbet Gummies 20-Pack (200mg) posted the steepest decline in September 2026, down 60.9% MoM to $5,214 while falling to rank 10, and Peach Mango Gummies 20-Pack (200mg) also contracted 10.3% MoM at rank 3, indicating erosion at both the tail and core of the lineup. Michigan Cherry Gummies 20-Pack (200mg) remained rank 1 despite a 21.9% MoM drop, whereas Hybrid Strawberry Lemonade Gummies 20-Pack (200mg) climbed 19.0% MoM at rank 2, creating a widening volatility gap between the top two SKUs. With all ten top sellers concentrated in Edibles and two launches entering at ranks 4 and 8 alongside a 31.5% MoM decline for Strawberry Cheesecake Gummies 20-Pack (200mg) at rank 5, the mix points to a reliance on flavor churn over sustained velocity. Taken together, the pattern implies PC Pure is leaning into breadth within Edibles while trading consistency for rapid rotation, signaling a need to stabilize flagship SKUs to protect rank leadership.
Top Selling Cannabis Brands






Data for this report comes from real-time sales reporting by participating cannabis retailers via their point-of-sale systems, which are linked up with Headset’s business intelligence software. Headset’s data is very reliable, as it comes digitally direct from our partner retailers. However, the potential does exist for misreporting in the instance of duplicates, incorrectly classified products, inaccurate entry of products into point-of-sale systems, or even simple human error at the point of purchase. Thus, there is a slight margin of error to consider. Brands listed on this page are ranked in the top twenty within the market and product category by total retail sales volume.

