Jun-2026
Sales
Trend
6-Month
Product Count
SKUs
Avg Price
YoY Sales Change
YoY Price Change
Market Insights Snapshot
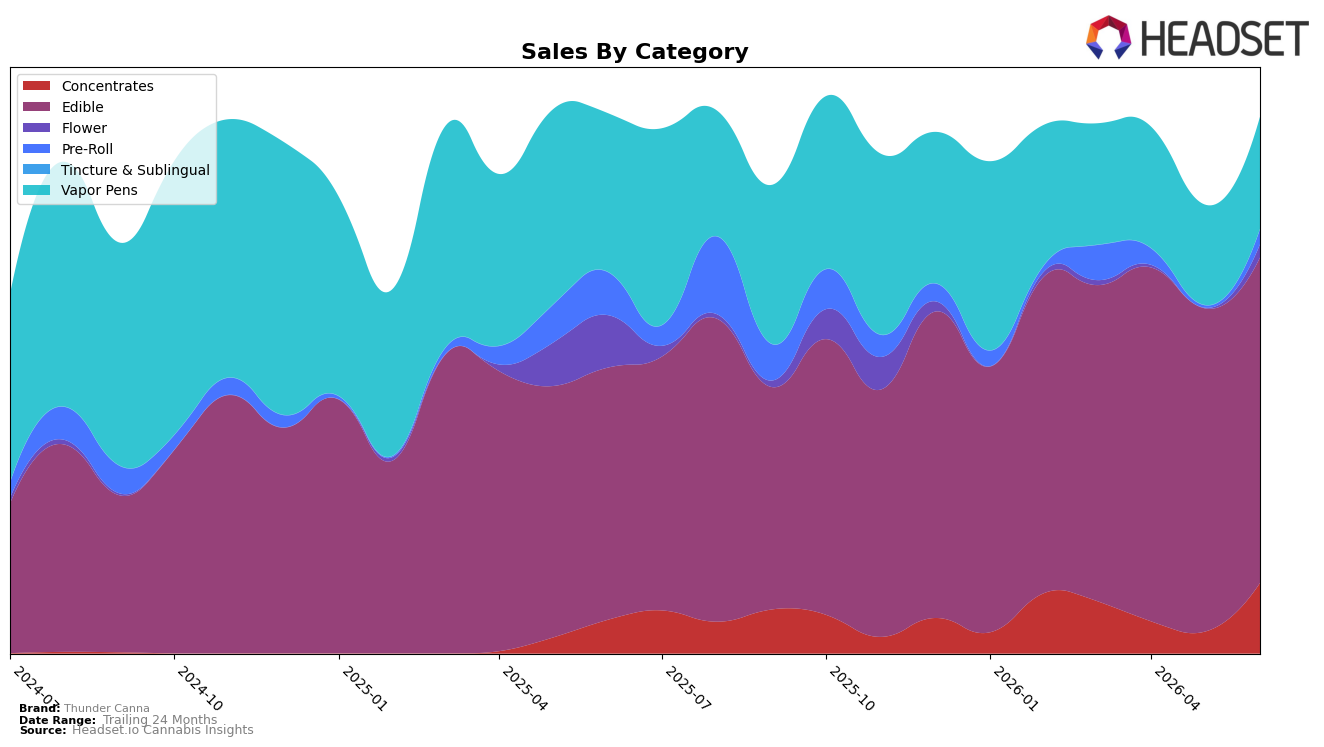
In June 2026, Thunder Canna concentrated 60.78% of sales in Edible with a 29.10% year-over-year increase and a 0.63% month-over-month lift, while Vapor Pens held 20.90% share with a -29.43% year-over-year decline but an 11.66% month-over-month uptick. Concentrates expanded to 13.15% share with 109.08% year-over-year growth and a 225.09% month-over-month jump, and Pre-Roll, though only 2.76% share, spiked 616.79% month-over-month despite a -65.27% year-over-year drop. Flower remained small at 2.41% share after a -75.16% year-over-year contraction but surged 4216.84% month-over-month, indicating a tactical rebound from a low base. Collectively, the mix shows Edible stability anchoring the portfolio while rapid month-over-month surges in Concentrates and Pre-Roll suggest near-term trial or re-listing dynamics that could reweight the brand if sustained.
The pattern implies Thunder Canna is pivoting toward an innovation-led, value-aware stance: the average price fell 40.72% year-over-year alongside a 96.97% sales increase over 24 months, while Edible’s steady month-over-month growth of 0.63% contrasts with outsized month-over-month spikes of 225.09% in Concentrates and 616.79% in Pre-Roll. With Vapor Pens down -29.43% year-over-year but up 11.66% month-over-month, the brand is likely reallocating price tiers and assortment toward faster-turn formats, which could reinforce its Edible-led identity while testing higher-velocity niches. The 16th rank in Michigan Edible paired with 29.10% Edible year-over-year growth indicates the positioning opportunity is to convert the short-term lift in smaller categories into sustained share without diluting the Edible anchor.
Competitive Landscape
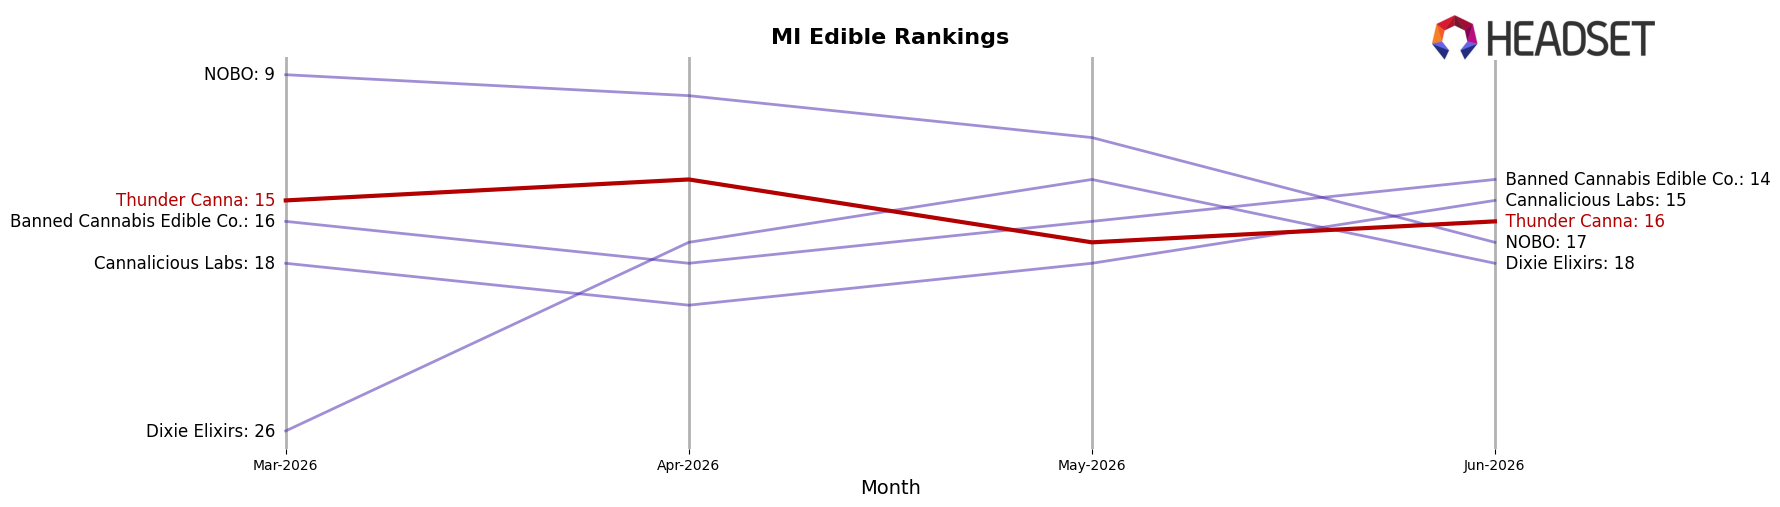
Thunder Canna sits at rank #16 in MI Edible in June 2026, improving 2 positions YoY from #18, but slipping 1 spot from March 2026’s #15 and 2 from its April 2026 peak at #14; this contrasts with Wyld holding #1 YoY at #1 despite a -13.4% sales change and Good Tide easing from #4 to #5 with a -16.2% sales change, while MKX Oil Company maintained #3 alongside a +10.8% uplift. With Choice steady at #2 despite a -1.8% sales dip and Camino rising from #5 to #4 on +15.7% growth, Thunder Canna’s modest YoY climb but quarter-over-quarter giveback implies mid-pack inertia where incremental gains risk being erased without a catalyst to reclaim and hold a top-15 position.
Notable Products
The steepest move in June 2026 came from Wonderful Watermelon Gummies 4-Pack (200mg), which fell 65.1% month over month while sitting at rank 10, as Pink Grapefruit Gummies 4-Pack (200mg) held rank 1 despite a 6.1% dip. In contrast, Optimal Orange Cream Gummies 4-Pack (200mg) surged 78.0% month over month to rank 2, while Classic - Cherry Gummies 4-Pack (200mg) slid 29.3% to rank 5. Eight of the top ten SKUs are Edible gummies, and the mix shows bifurcation with two declines over 20% alongside a top-three gain near 80%, implying the portfolio is consolidating around a few momentum flavors while pruning laggards.
Top Selling Cannabis Brands
Data for this report comes from real-time sales reporting by participating cannabis retailers via their point-of-sale systems, which are linked up with Headset’s business intelligence software. Headset’s data is very reliable, as it comes digitally direct from our partner retailers. However, the potential does exist for misreporting in the instance of duplicates, incorrectly classified products, inaccurate entry of products into point-of-sale systems, or even simple human error at the point of purchase. Thus, there is a slight margin of error to consider. Brands listed on this page are ranked in the top twenty within the market and product category by total retail sales volume.

