Jun-2026
Sales
Trend
6-Month
Product Count
SKUs
Avg Price
YoY Sales Change
YoY Price Change
Market Insights Snapshot
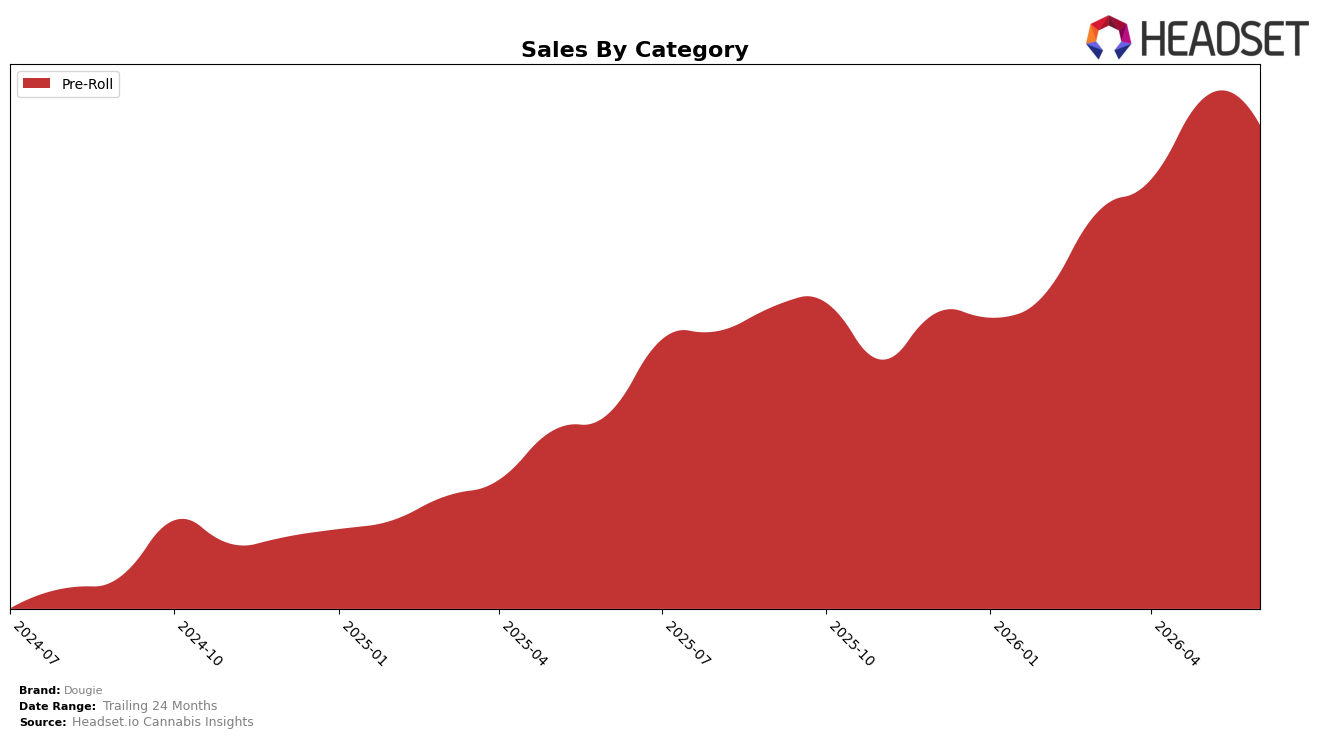
In June 2026, Dougie operated as a single-category brand with Pre-Roll accounting for 100.0% of sales, while average price contracted 16.63% year over year and category sales expanded 123.28% year over year. Month over month, Pre-Roll sales declined 5.00% alongside a flat category mix at 100.0%, placing Dougie at rank 7 in Oregon Pre-Roll. The combination of triple-digit year-over-year growth and a single-digit month-over-month pullback implies a volume-led expansion model that is sensitive to short-cycle price or assortment changes within Pre-Roll.
The exclusive focus on Pre-Roll concentrates positioning toward value-density: a 16.63% price decrease paired with 123.28% year-over-year sales growth indicates elasticity-driven share capture within the segment, while the 5.00% month-over-month slippage and rank 7 in Oregon suggest ceiling pressure when price cuts outpace differentiation. This pattern implies Dougie’s near-term upside hinges on sustaining Pre-Roll velocity at lower price points while managing margin risk, and that medium-term resilience may require either premium sub-lines or adjacent-category trials to reduce exposure to Pre-Roll-specific volatility.
Competitive Landscape
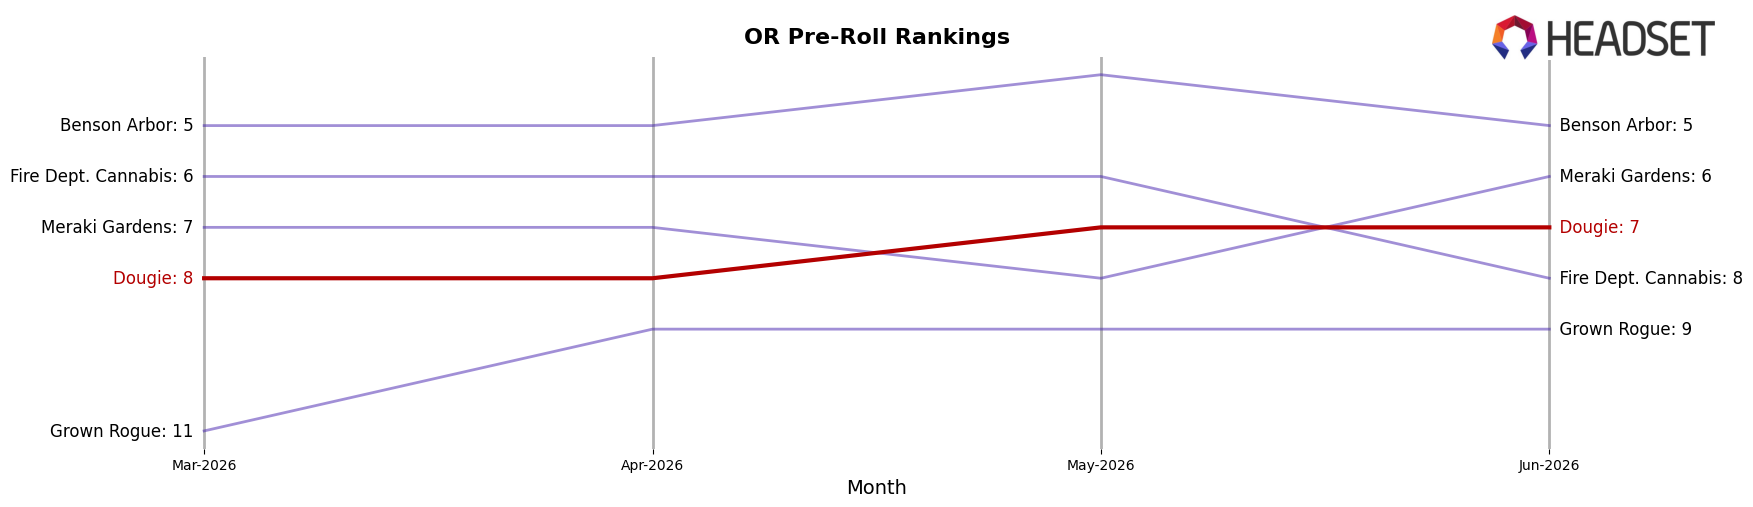
Dougie sits at rank #7 in OR Pre-Roll in June 2026, improving 14 positions from #21 year over year and edging up 1 place from #8 in March 2026; this also matches its peak rank of #7 in June 2026, indicating a ceiling test while still posting sequential momentum. In contrast, STiCKS moved from #2 to #1 as of June 2026 with 164.98% YoY sales growth, while Kaprikorn advanced from #5 to #2 on 113.36% YoY growth; meanwhile, Portland Heights fell from #3 to #4 with a -26.34% YoY sales change, and Benson Arbor slipped from #4 to #5 with -27.42% YoY, positioning Dougie’s upward rank shift as a share-capture opportunity against declining mid-pack peers while still trailing faster climbers at the top.
Notable Products
Fog Dog Infused Blunt (1g) posted the steepest movement in June 2026 with a -39.9% month-over-month decline and sat at rank 3, while Space Candy Infused Blunt (1g) rose 10.6% MoM to rank 7. Clementine Infused Blunt (1g) fell -17.6% MoM at rank 2, and Watermelon Mojito Infused Blunt (1g) held rank 1 with $11,274 in sales. Eight of the top ten are Pre-Roll SKUs, and Za-Glue Infused Blunt (1g) slipped -5.3% MoM at rank 8, indicating the category is consolidated at the top but vulnerable to sharp intra-line volatility. The pattern implies Dougie is leaning into concentrated Pre-Roll leadership while needing SKU pruning or reformulation where double-digit MoM erosion threatens share.
Top Selling Cannabis Brands
Data for this report comes from real-time sales reporting by participating cannabis retailers via their point-of-sale systems, which are linked up with Headset’s business intelligence software. Headset’s data is very reliable, as it comes digitally direct from our partner retailers. However, the potential does exist for misreporting in the instance of duplicates, incorrectly classified products, inaccurate entry of products into point-of-sale systems, or even simple human error at the point of purchase. Thus, there is a slight margin of error to consider. Brands listed on this page are ranked in the top twenty within the market and product category by total retail sales volume.

