Market Insights Snapshot
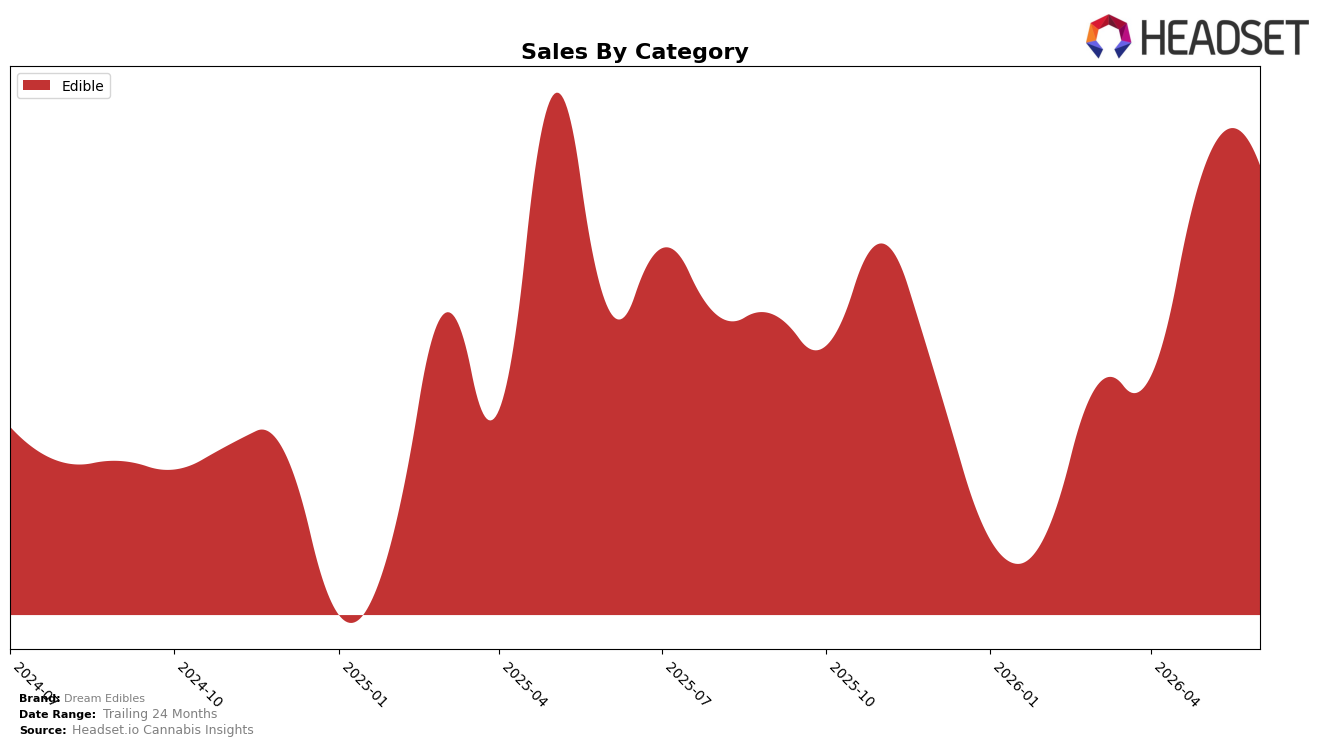
In June 2026, Dream Edibles operated as a single-category brand with Edible accounting for 100.0% of sales, posting year-over-year growth of 16.3% alongside a month-over-month uptick of 0.1%. Within Michigan Edibles, the brand sat at rank 30 while its average item price rose 42.0% year over year to $13.20, indicating mix and pricing shifts outpacing its 16.3% sales growth rate. The pattern implies a price-led expansion within Edibles that lifted revenue but did not propel a rank climb beyond 30, suggesting pricing elasticity is being tested without immediate share gain.
The combination of a 42.0% average price increase and only 0.1% month-over-month sales growth in June 2026, against a 16.3% year-over-year gain, points to positioning that leans on premiumization more than volume capture. Being rank 30 in Michigan Edibles while holding a 100.0% category focus implies limited diversification and a reliance on price architecture to sustain growth, which may cap near-term rank mobility if competitors emphasize velocity over price; the implication is that Dream Edibles’ current stance prioritizes margin per unit over share-accretive breadth.
Competitive Landscape
Dream Edibles is ranked #30 in MI Edible in June 2026, improving 1 rank position year over year from #31, and rising 6 spots versus March 2026 from #36 to #30; however, it remains 5 places below its peak of #25 reached in May 2025. By comparison, Wyld held at #1 year over year while posting a -13.4% sales change, and MKX Oil Company stayed at #3 with a +10.8% sales change, indicating Dream Edibles is inching up ranks while the category leader contracts and a top-three player expands. The pattern implies Dream Edibles’ modest rank climb is driven more by relative shifts among leaders than by a breakout, suggesting incremental share capture is possible if it sustains momentum against mixed competitor trajectories.

Notable Products
Pot Pots - Milk Chocolates 100-Pack (100mg) delivered the headline move with a 163.9% month-over-month jump and held rank 1, while Watermelon Pixils 20-Pack (200mg) surged 50.6% to rank 4. At the same time, Grape Pixils 20-Pack (200mg) fell 17.3% at rank 8 and Potpots - Dark Chocolate Bites 100-Pack (100mg) slipped 3.5% at rank 2. Four of the top ten are Pixils SKUs concentrated in ranks 4–8, indicating gummies are gaining breadth even as the flagship chocolate anchors the top spot with $73,806 in June 2026. The mix implies Dream Edibles is shifting toward a two-pillar lineup where a breakout chocolate drives share while an expanding Pixils block diversifies demand and cushions category-specific volatility.
Top Selling Cannabis Brands
Data for this report comes from real-time sales reporting by participating cannabis retailers via their point-of-sale systems, which are linked up with Headset’s business intelligence software. Headset’s data is very reliable, as it comes digitally direct from our partner retailers. However, the potential does exist for misreporting in the instance of duplicates, incorrectly classified products, inaccurate entry of products into point-of-sale systems, or even simple human error at the point of purchase. Thus, there is a slight margin of error to consider. Brands listed on this page are ranked in the top twenty within the market and product category by total retail sales volume.

