Market Insights Snapshot
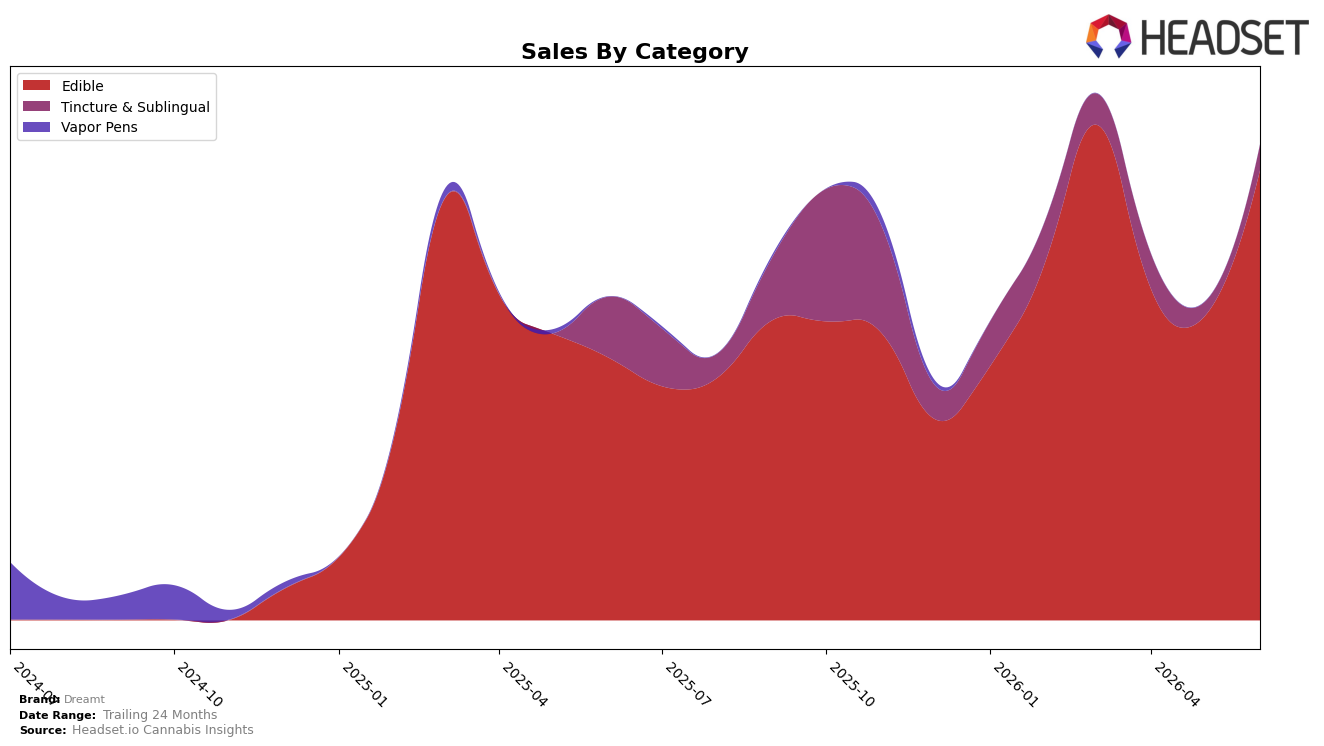
Dreamt concentrated 94.69% of June 2026 sales in Edible, with the segment up 71.34% year over year and 48.08% month over month, while Tincture & Sublingual held 5.31% share with a 58.21% YoY decline but an 81.38% MoM rebound. The average price fell 22.66% YoY to $16.77 alongside a 47.13% YoY lift in brand sales, and the brand sat at rank 44 within Edible in New Jersey. The pattern implies Dreamt is leaning into lower-priced Edible velocity while treating Tincture & Sublingual as a small, tactical contributor that is volatile month to month.
With Edible expanding share to 94.69% as it grew 48.08% MoM versus an 81.38% MoM spike from a much smaller Tincture & Sublingual base, the mix points to a scale strategy anchored in Edible throughput rather than portfolio balance. The 22.66% YoY price decrease alongside a 71.34% YoY Edible surge and a rank of 44 in New Jersey suggests a positioning built on accessible price points to climb rankings, with limited reliance on higher-priced Tincture & Sublingual at a 5.31% share despite its short-term MoM recovery.
Competitive Landscape
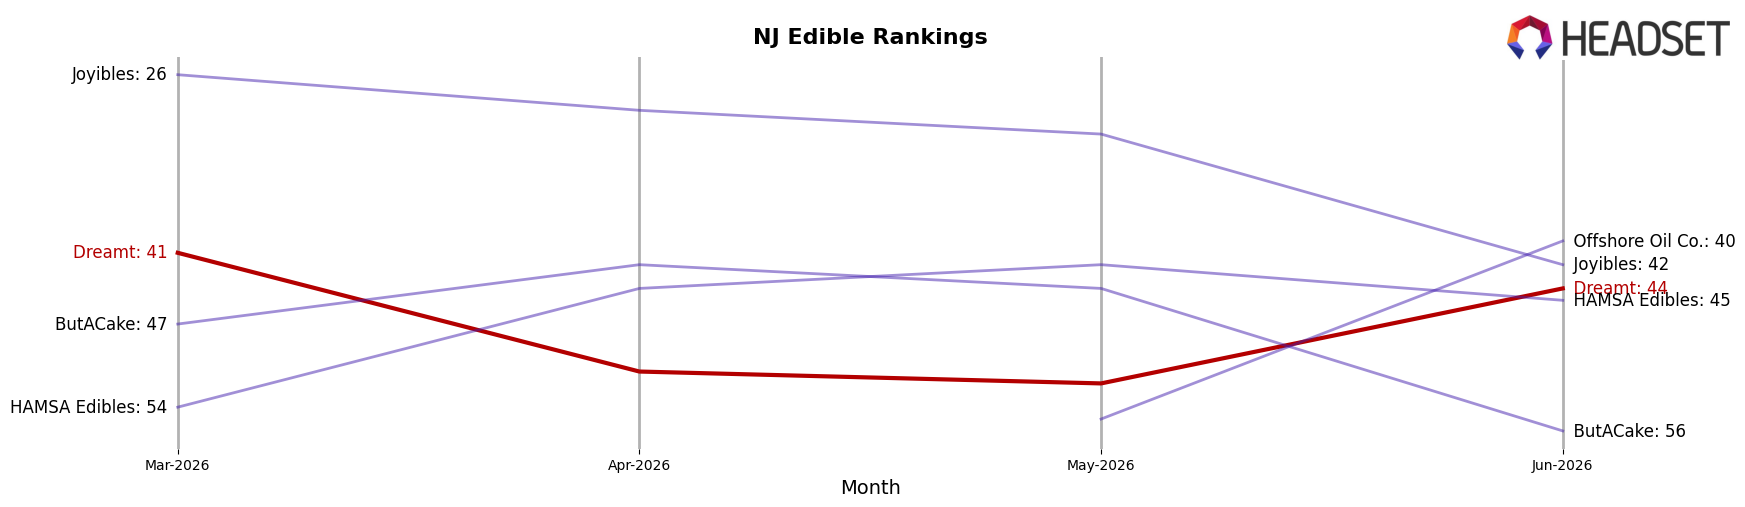
Dreamt sits at rank 44 in June 2026, down 1 position year over year from rank 43 and 3 positions below its March 2026 peak at rank 41, signaling slippage versus earlier momentum; meanwhile, Wyld moved up from rank 4 to rank 2 while growing sales 28.1% YoY, and Gron / Grön held rank 1 despite a 22.1% YoY sales decline, indicating leaders are either consolidating position or trading on established share while Dreamt’s 3-month rank drift from 41 to 44 points to erosion in relative competitiveness. The pattern implies that without a reversal from a 1-rank YoY decline and a 3-rank slide since March 2026, Dreamt is likely to cede further shelf visibility as upward movers like OGEEZ climb from rank 9 to rank 5 on 44.6% YoY sales growth.
Notable Products
CBD/THC/CBN 2:5:1 Midnight Berry Soft Lozenges 10-Pack (20mg CBD, 100mg THC, 10mg CBN) posted the largest month-over-month move in June 2026 at +723.5%, entering the top ten at rank 6 while CBD/THC 2.5:1 Sleep Tincture (60mg CBD, 150mg THC, 60ml) climbed +81.3% to rank 5. The CBD/CBN/THC 4:2:1 Midnight Berry Gummies (40mg CBD, 20mg CBN, 100mg THC) rose +58.9% to rank 1, and Honey Lemon Gummies 20-Pack (100mg) surged +126.4% to rank 4, while the smaller Honey Lemon Gummies 2-Pack (20mg) grew a modest +5.6% at rank 3. With six of the top ten coming from the Edible category and only one Tincture & Sublingual in the top five, the mix indicates Dreamt is leaning into higher-potency edible formats and multipack value to drive upside.
Top Selling Cannabis Brands
Data for this report comes from real-time sales reporting by participating cannabis retailers via their point-of-sale systems, which are linked up with Headset’s business intelligence software. Headset’s data is very reliable, as it comes digitally direct from our partner retailers. However, the potential does exist for misreporting in the instance of duplicates, incorrectly classified products, inaccurate entry of products into point-of-sale systems, or even simple human error at the point of purchase. Thus, there is a slight margin of error to consider. Brands listed on this page are ranked in the top twenty within the market and product category by total retail sales volume.

