May-2026
Sales
Trend
6-Month
Product Count
SKUs
Avg Price
YoY Sales Change
YoY Price Change
Market Insights Snapshot
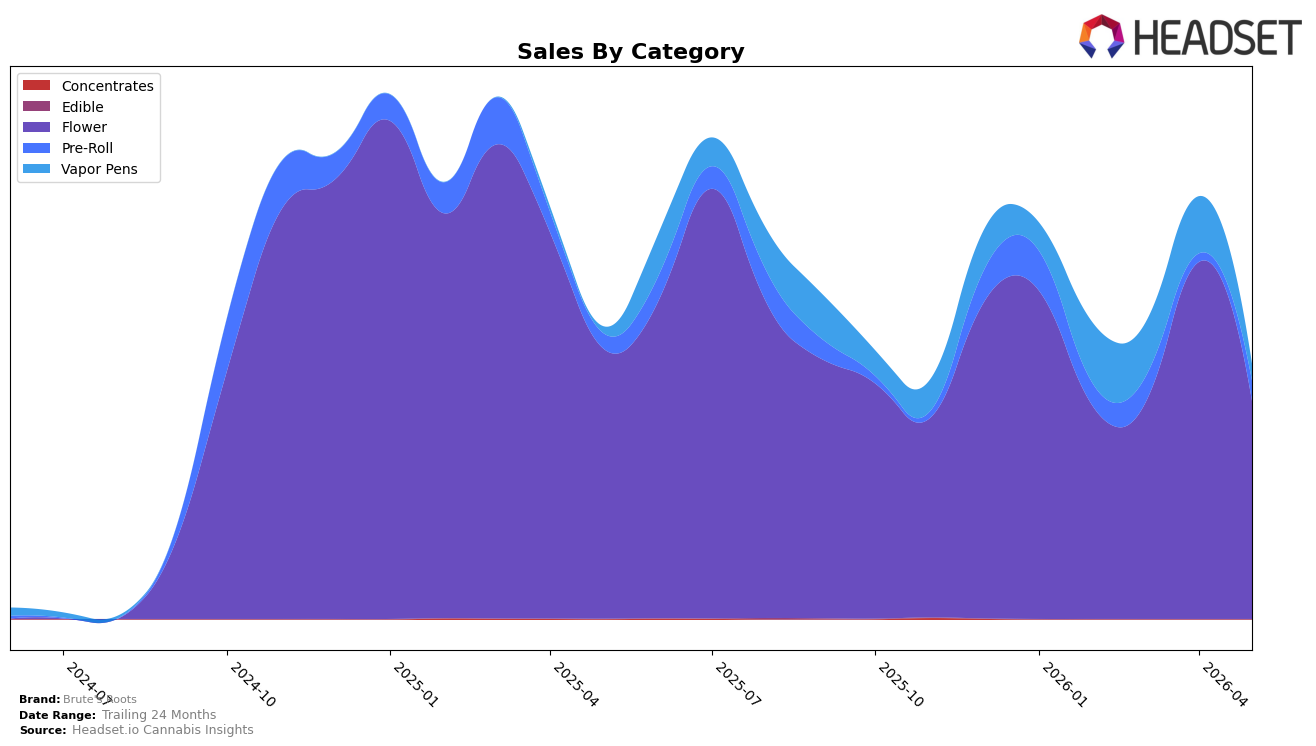
Brute's Roots concentrated 85.69% of May 2026 sales in Flower, where year-over-year sales fell 19.30% and month-over-month slipped 38.97%, while Pre-Roll rose to 7.85% share with 32.35% YoY growth and 145.52% MoM expansion. Vapor Pens held 6.46% share with 154.81% YoY growth but a 71.13% MoM decline, and the brand’s average price fell 30.97% YoY to $27.19 as Flower pricing sat at 42.69. With a Flower category rank of 29 in New Jersey and brand-level sales down 12.85% YoY, the pattern implies an overexposure to a contracting Flower base offset by tactical gains in Pre-Roll that are not yet large enough to counter near-term volume volatility.
The mix shift—Pre-Roll up 145.52% MoM against Flower down 38.97% MoM and Vapor Pens down 71.13% MoM—suggests Brute's Roots is using aggressive price moves (average price down 30.97% YoY) to recruit into lower-ticket formats while reducing reliance on a lagging Flower anchor at 85.69% share. Given a 154.81% YoY lift in Vapor Pens alongside a 32.35% YoY gain in Pre-Roll but a 19.30% YoY drop in Flower, the positioning implication is a pivot toward value-led, multi-format trial that can improve rank from 29 in New Jersey only if Pre-Roll and Vapor Pens scale share beyond the current combined 14.31% and stabilize the sharp month-to-month swings.
Competitive Landscape
Brute's Roots sits at rank #29 in NJ Flower in May 2026, down 4 positions year over year from #25 and 1 position from February 2026 when it was #28; the brand’s peak of #14 in July 2025 marks a 15-rank slide to the current spot. Against this backdrop, Find. climbed from #15 to #1 with 189.3% year-over-year sales growth, while Ozone slipped from #1 to #2 amid a 25.9% decline, and Grassroots moved from #8 to #3 with 39.9% growth; the spread between Brute's Roots at #29 and top-5 peers implies that regaining mid-tier presence will likely require either recapturing share lost since July 2025 or repositioning away from head-to-head with faster risers.

Notable Products
Brute's Blend Pre-Roll (1g) delivered the headline shift in May 2026 with a +168% month-over-month surge that vaulted it to rank 2, while Blue Zushi Pre-Roll (1g) rose +87% MoM to rank 1, indicating that Pre-Roll momentum is outrunning Flower in the short term. Honey Badger (3.5g) gained +30% MoM yet sits at rank 3 behind two Pre-Rolls, and Z Marker Smalls (3.5g) plunged -76% MoM to rank 9, signaling volatility within value-tier Flower. With eight of the top ten SKUs in the Flower family but the top two slots taken by Pre-Rolls, the mix points to a pivot toward ready-to-use formats driving trial and visibility while bulk Flower anchors volume with uneven consistency. The pattern implies Brute's Roots is leaning into Pre-Rolls for velocity and laddering Flower to maintain breadth, suggesting near-term merchandising should prioritize Pre-Roll prominence while pruning underperforming smalls.
Top Selling Cannabis Brands
Data for this report comes from real-time sales reporting by participating cannabis retailers via their point-of-sale systems, which are linked up with Headset’s business intelligence software. Headset’s data is very reliable, as it comes digitally direct from our partner retailers. However, the potential does exist for misreporting in the instance of duplicates, incorrectly classified products, inaccurate entry of products into point-of-sale systems, or even simple human error at the point of purchase. Thus, there is a slight margin of error to consider. Brands listed on this page are ranked in the top twenty within the market and product category by total retail sales volume.

