.svg)

Aug-2026
Sales
Trend
6-Month
Product Count
SKUs
Avg Price
YoY Sales Change
YoY Price Change


Where to Buy
SUN is stocked at 26 licensed dispensaries across New Jersey, with the deepest coverage in Newark, Woodbury, Atlantic City, Bordentown, and Clementon. Search by ZIP code or city below to find the closest one, or filter by product type if you are after a specific format.
Market Insights Snapshot
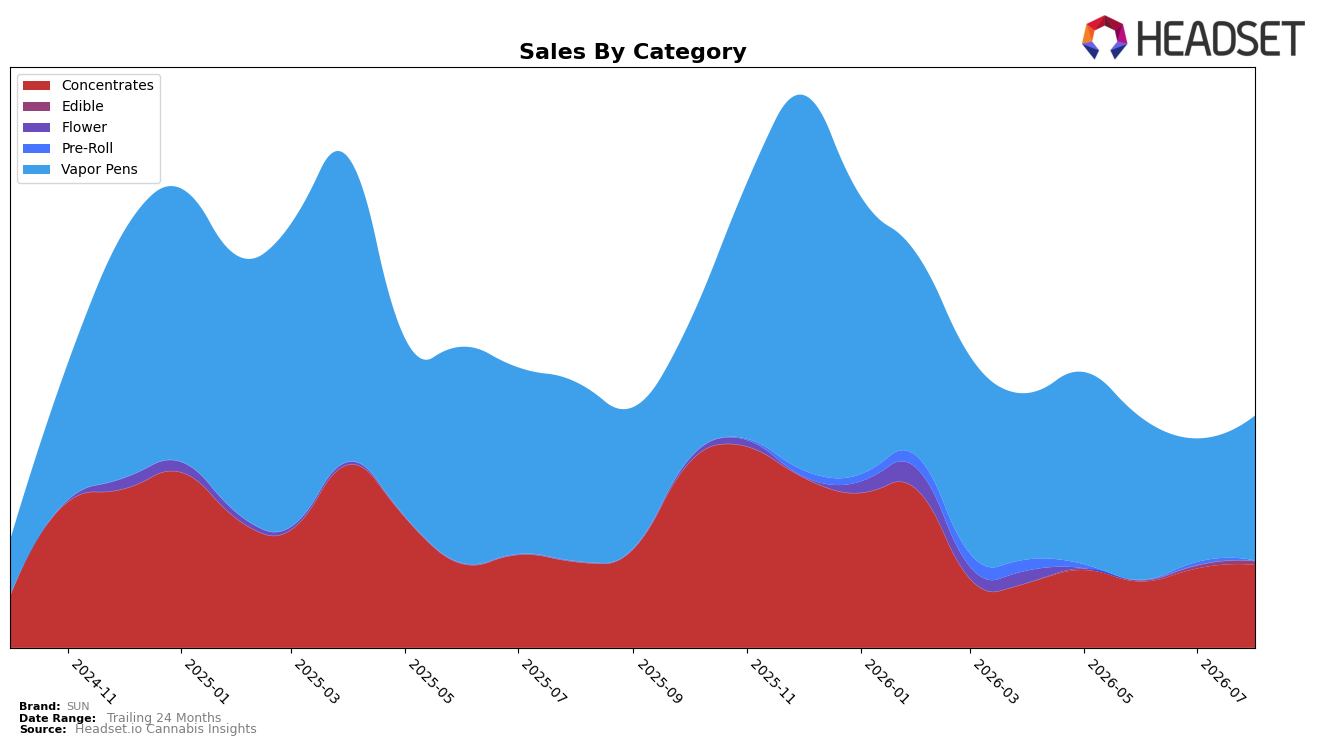
In August 2026, SUN’s mix concentrated in Vapor Pens at 62.75% share with a 17.51% month-over-month lift but a 19.04% year-over-year drop, while Concentrates held 35.84% share with a 4.50% MoM increase and a 3.25% YoY decline; Edible remained a minor 1.42% share despite a 27.52% MoM rise and no YoY baseline. The brand’s overall average price decreased 5.43% YoY to $44.64, contrasting with Vapor Pens’ higher category price at $46.96 and Concentrates at $43.35, and SUN sat at rank 63 in Vapor Pens in New Jersey. The pattern implies SUN is leaning into short-term volume recovery via Vapor Pens and Concentrates MoM gains while carrying a YoY drag from its heaviest-weight category, suggesting mix-led volatility where recovery depends on stabilizing Vapor Pens’ annual trajectory.
With Vapor Pens still the anchor at 62.75% and rank 63 in New Jersey, the 17.51% MoM rebound alongside a 19.04% YoY contraction points to tactical momentum over structural strength, while Concentrates’ 4.50% MoM lift against a milder 3.25% YoY decline offers a comparatively steadier base. The 5.43% YoY average price decrease, alongside a premium Vapor Pens price versus the brand average, indicates price rationalization likely aimed at sustaining MoM gains without fully offsetting YoY softness. The implication is a positioning pivot toward defending share in Vapor Pens through near-term pricing and activation while using Concentrates as a ballast for consistency, with limited diversification from Edible at 1.42% share keeping SUN exposed to Vapor Pens’ rank and YoY headwinds.
Competitive Landscape
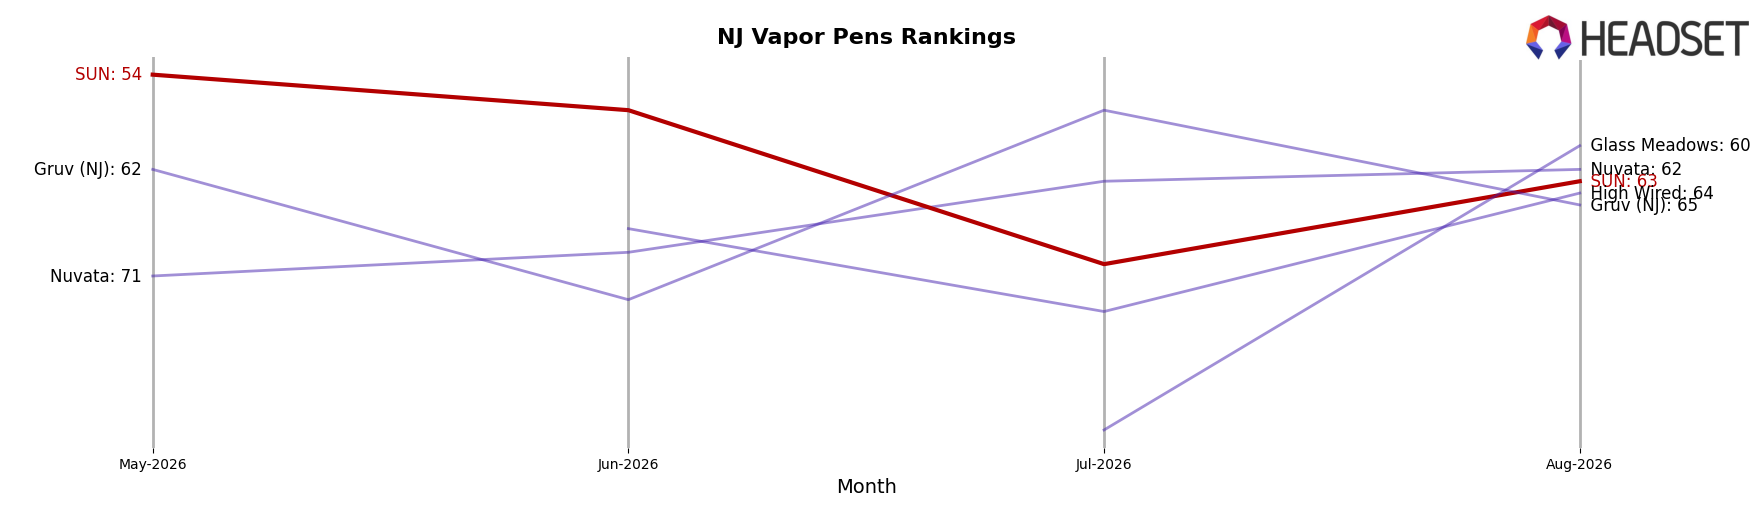
In New Jersey Vapor Pens, SUN ranks #63 in August 2026, down 13 positions from #50 year over year, and 9 positions below its May 2026 mark of #54, despite a historical peak of #33 in December 2024; meanwhile, Select held #1 with a -21.2% year-over-year sales change and RYTHM advanced from #7 to #5 alongside a 14.0% year-over-year sales increase, indicating SUN’s relative decline is driven less by top-tier contraction and more by mid-tier upward mobility that is compressing ranks below the top 10—implying SUN’s trajectory points toward further share erosion unless its rank slide from #54 to #63 since May 2026 is reversed.
Notable Products
Eclipse X Bass River Buds Cured Resin Badder (1g) delivered the standout move in August 2026 with +138.2% MoM to rank 2, while Pink Kush Live Resin Cartridge (1g) fell -55.4% MoM to rank 8. MAC Live Resin Badder (1g) also surged +92.8% MoM at rank 3, whereas Mango Diesel Live Resin Sauce (1g) declined -19.3% MoM at rank 5. Four of the top ten are Concentrates, and Vapor Pens occupy five top-10 slots with mixed momentum, implying SUN is tilting assortment energy toward high-velocity Concentrates while trimming underperforming pens.
Top Selling Cannabis Brands






Data for this report comes from real-time sales reporting by participating cannabis retailers via their point-of-sale systems, which are linked up with Headset’s business intelligence software. Headset’s data is very reliable, as it comes digitally direct from our partner retailers. However, the potential does exist for misreporting in the instance of duplicates, incorrectly classified products, inaccurate entry of products into point-of-sale systems, or even simple human error at the point of purchase. Thus, there is a slight margin of error to consider. Brands listed on this page are ranked in the top twenty within the market and product category by total retail sales volume.

