.svg)


Where to Buy
D's Trees is stocked at 25 licensed dispensaries across Maine and Colorado, 13 of them in Maine, with the deepest coverage in Biddeford, Lewiston, Portland, Auburn, and Bath. Search by ZIP code or city below to find the closest one, or filter by product type if you are after a specific format.
Market Insights Snapshot
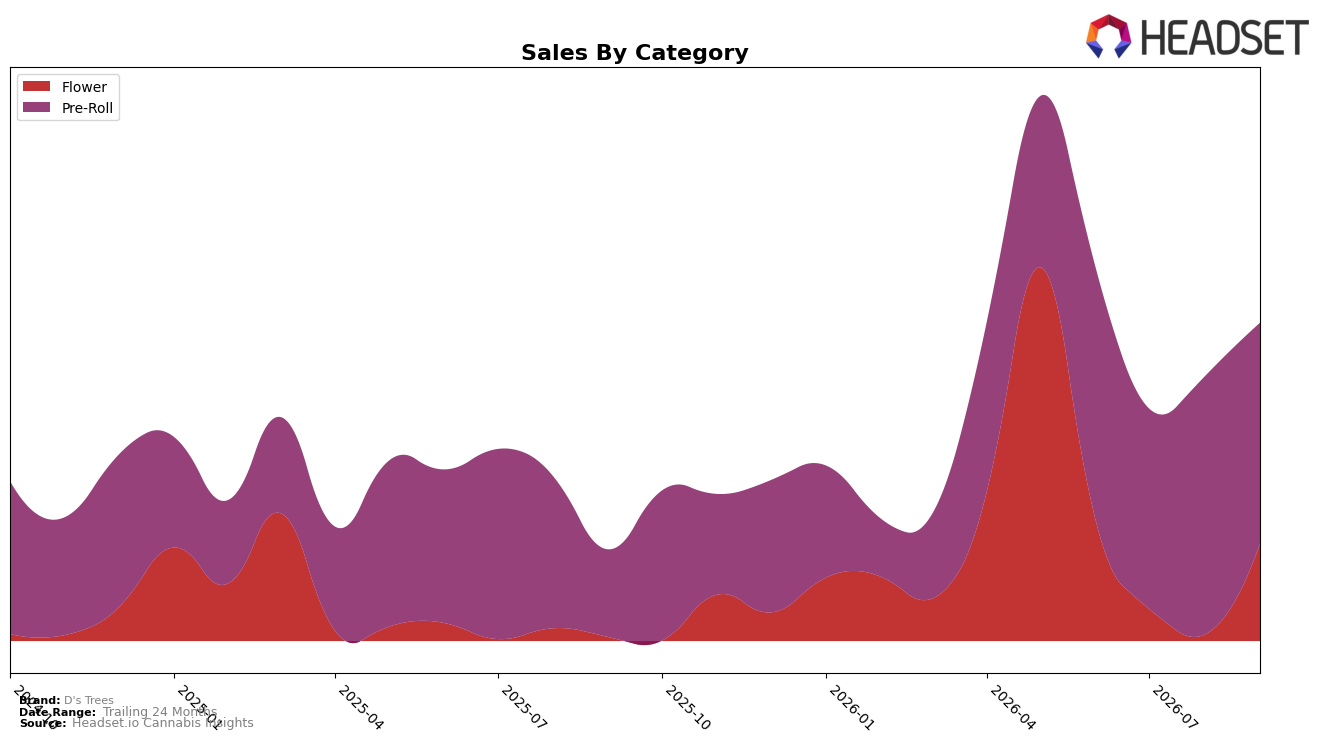
In September 2026, D's Trees concentrated 69.45% of sales in Pre-Roll while Flower represented 30.55%, with Pre-Roll down 14.40% month over month yet up 152.59% year over year, and Flower up 1,467.49% month over month and 2,488.76% year over year. Despite a 32.94% year-over-year increase in average price to $7.19, Pre-Roll volume share remained dominant as Flower’s rapid mix expansion rebalanced the portfolio, implying the brand is migrating from a single-category anchor toward a two-pillar mix where Flower’s surge offsets Pre-Roll’s monthly pullback.
Positioning-wise, the shift pushes D's Trees toward a value-led Pre-Roll core (average Pre-Roll price at 5.33) paired with a premium-adjacent Flower offering (average Flower price at 34.85), and a Pre-Roll category rank of 26 in Colorado sets a mid-pack benchmark as the brand leans into Flower momentum. With brand sales up 248.74% year over year and 169.65% over 24 months, the mix transition suggests headroom to convert Flower’s outsized growth into sustained rank gains while using Pre-Roll’s scale to stabilize share during months when Pre-Roll slips in rank or growth.
Competitive Landscape
D's Trees sits at rank #26 in CO Pre-Roll in September 2026 after improving 19 positions year over year from #45, but it slipped 2 ranks from a three-month level of #24 despite having reached a peak of #24 in June 2026. Meanwhile, Cali-Blaze climbed from #2 to #1 with 67.17% YoY sales growth, and Be One Kind jumped from #22 to #4 on 463.70% YoY growth, indicating that share is consolidating among faster-advancing leaders while D's Trees’ recent 2-rank slide against a 19-rank YoY gain implies momentum that is cooling quarter-over-quarter and risks ceding shelf visibility if not reversed.

Notable Products
Greasy Lady Pre-Roll (1g) posted the steepest move in September 2026 with a -64.41% month-over-month drop while sliding to rank 9, contrasting with Black Chrome Pre-Roll (1g) surging +61.15% to rank 1. Gelato Cake Pre-Roll (1g) also declined -26.77% at rank 6, and Grapes & Cream Pre-Roll (1g) inched up +7.23% at rank 3. With nine of the top ten SKUs concentrated in Pre-Roll, the mix points to a pivot toward a few high-velocity Pre-Rolls driving share while lower performers get culled.
Black Chrome Pre-Roll (1g) now leads at rank 1 with approximately $19,186 in September 2026 sales and a +61.15% MoM gain, outpacing the flat-to-negative movement seen in rank 6 and rank 9 Pre-Rolls by 87.91 percentage points and 125.56 percentage points respectively. Lemon Cherry Gelato Popcorn (1g) holds rank 10 in Flower with no reported MoM change, indicating limited cross-category momentum versus the Pre-Roll tier that spans ranks 1 through 9. The pattern implies D's Trees is consolidating around a breakout Pre-Roll core while deprioritizing volatile tail SKUs and letting Flower play a perimeter role.
Top Selling Cannabis Brands






Data for this report comes from real-time sales reporting by participating cannabis retailers via their point-of-sale systems, which are linked up with Headset’s business intelligence software. Headset’s data is very reliable, as it comes digitally direct from our partner retailers. However, the potential does exist for misreporting in the instance of duplicates, incorrectly classified products, inaccurate entry of products into point-of-sale systems, or even simple human error at the point of purchase. Thus, there is a slight margin of error to consider. Brands listed on this page are ranked in the top twenty within the market and product category by total retail sales volume.

