.svg)

Sep-2026
Sales
Trend
6-Month
Product Count
SKUs
Avg Price
YoY Sales Change
YoY Price Change


Where to Buy
TWAX is stocked at 169 licensed dispensaries across Colorado, Missouri, and 4 other states, 57 of them in Colorado, with the deepest coverage in Denver, Colorado Springs, Grand Junction, Boulder, and Fort Morgan. Search by ZIP code or city below to find the closest one, or filter by product type if you are after a specific format.
Market Insights Snapshot
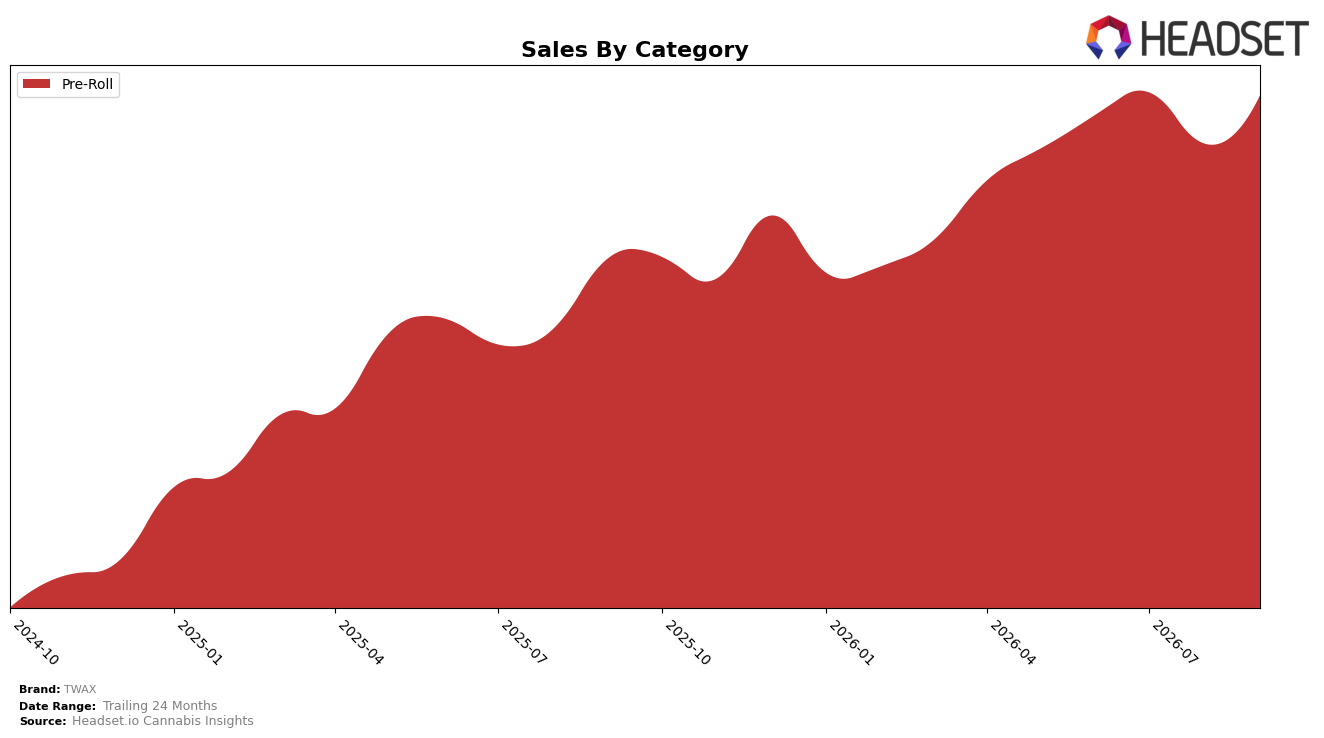
In September 2026, TWAX operated as a single-category brand with Pre-Roll accounting for 100.0% of sales, posting year-over-year growth of 32.1% and month-over-month growth of 7.8%. Average price declined 8.8% YoY to $14.78 while category share remained concentrated at 100.0%, implying that unit expansion rather than mix diversification drove the 32.1% YoY increase. With a Pre-Roll rank of 7 in Colorado and MoM acceleration of 7.8%, the data points to a scale-through-volume posture where price elasticity is being used to gain throughput within the same category.
The tighter price—down 8.8% YoY alongside a 7.8% MoM lift—suggests TWAX is trading off margin to sustain velocity and defend a rank of 7 in Colorado, rather than pursuing premium positioning. The 100.0% reliance on Pre-Roll combined with 32.1% YoY growth implies a concentration strategy where assortment depth and price architecture in Pre-Roll are the levers for share capture, making future gains sensitive to Pre-Roll market swings and less buffered by cross-category hedging.
Competitive Landscape
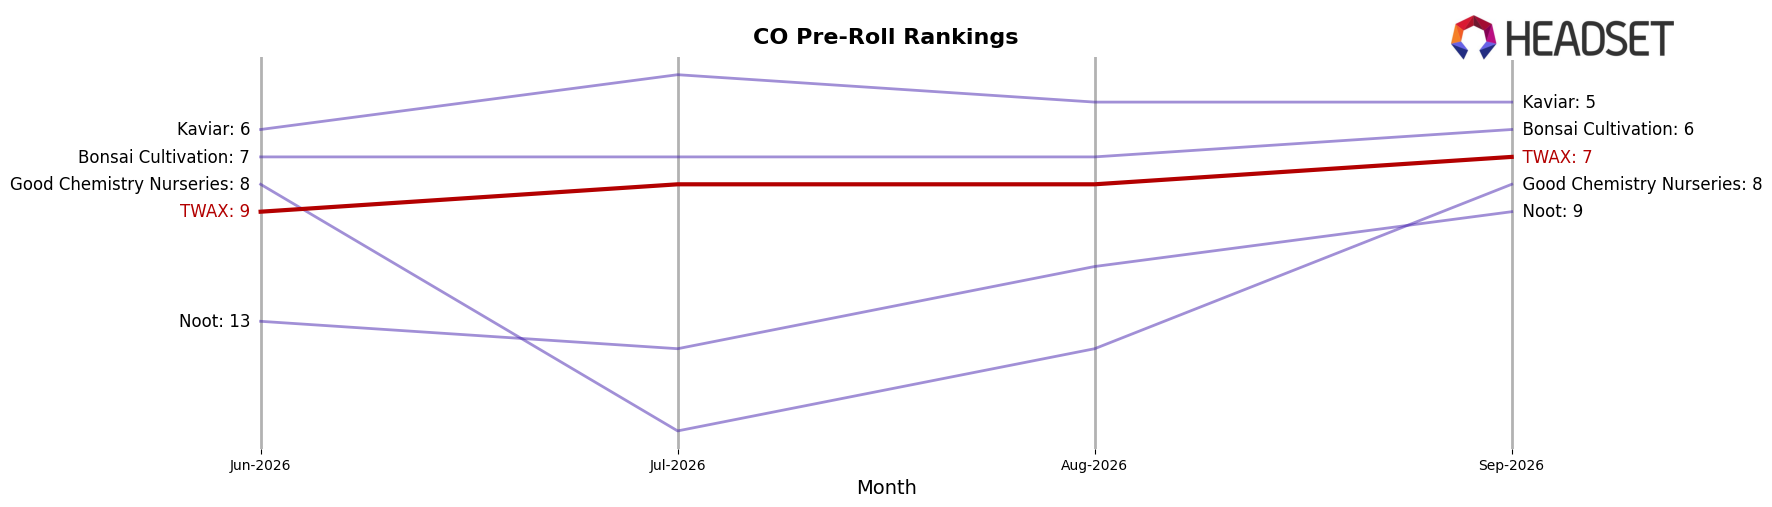
TWAX sits at rank 7 in Colorado Pre-Roll in September 2026, improving 8 positions year over year from rank 15 and climbing 2 spots from rank 9 in June 2026, marking a new peak at rank 7 in September 2026. In contrast, Cali-Blaze moved from rank 2 to rank 1 with year-over-year sales up 67.2%, while Green Label Cannabis slipped from rank 1 to rank 2 despite a 14.5% sales increase, and Be One Kind surged from rank 22 to rank 4 alongside a 463.7% sales jump. The combination of an 8-rank YoY ascent to rank 7 and a 2-rank gain over the last three months implies TWAX is breaking into the top tier but must outpace rapidly ascending rivals to convert this trajectory into durable top-5 presence.
Notable Products
Blueberry Distillate Infused Pre-Roll (1g) posted the steepest decline at -33.8% month over month and slid to rank 6, while Banana Cream Distillate Infused Pre-Roll (1g) fell -16.2% and held rank 3. Grapevine Distillate Infused Pre-Roll (1g) rose 43.4% to rank 1, and Pure Pear Distillate Infused Pre-Roll (1g) climbed 43.0% to rank 8, with Strawberry Banana Distillate Infused Pre-Roll (1g) down -9.5% at rank 4. Nine of the top ten are Pre-Roll SKUs, and the lone multi-pack at rank 10 signals format experimentation even as single 1g sticks dominate mix by rank concentration. The pattern implies TWAX is consolidating around single-serve infused Pre-Rolls while pruning or repositioning underperforming fruit flavors.
Top Selling Cannabis Brands






Data for this report comes from real-time sales reporting by participating cannabis retailers via their point-of-sale systems, which are linked up with Headset’s business intelligence software. Headset’s data is very reliable, as it comes digitally direct from our partner retailers. However, the potential does exist for misreporting in the instance of duplicates, incorrectly classified products, inaccurate entry of products into point-of-sale systems, or even simple human error at the point of purchase. Thus, there is a slight margin of error to consider. Brands listed on this page are ranked in the top twenty within the market and product category by total retail sales volume.

