.svg)

Aug-2026
Sales
Trend
6-Month
Product Count
SKUs
Avg Price
YoY Sales Change
YoY Price Change


Where to Buy
East Fork Cultivars is stocked at 205 licensed dispensaries across Oregon, Michigan, and Washington, 186 of them in Oregon, with the deepest coverage in Portland, Eugene, Bend, Beaverton, and Corvallis. Search by ZIP code or city below to find the closest one, or filter by product type if you are after a specific format.
Market Insights Snapshot
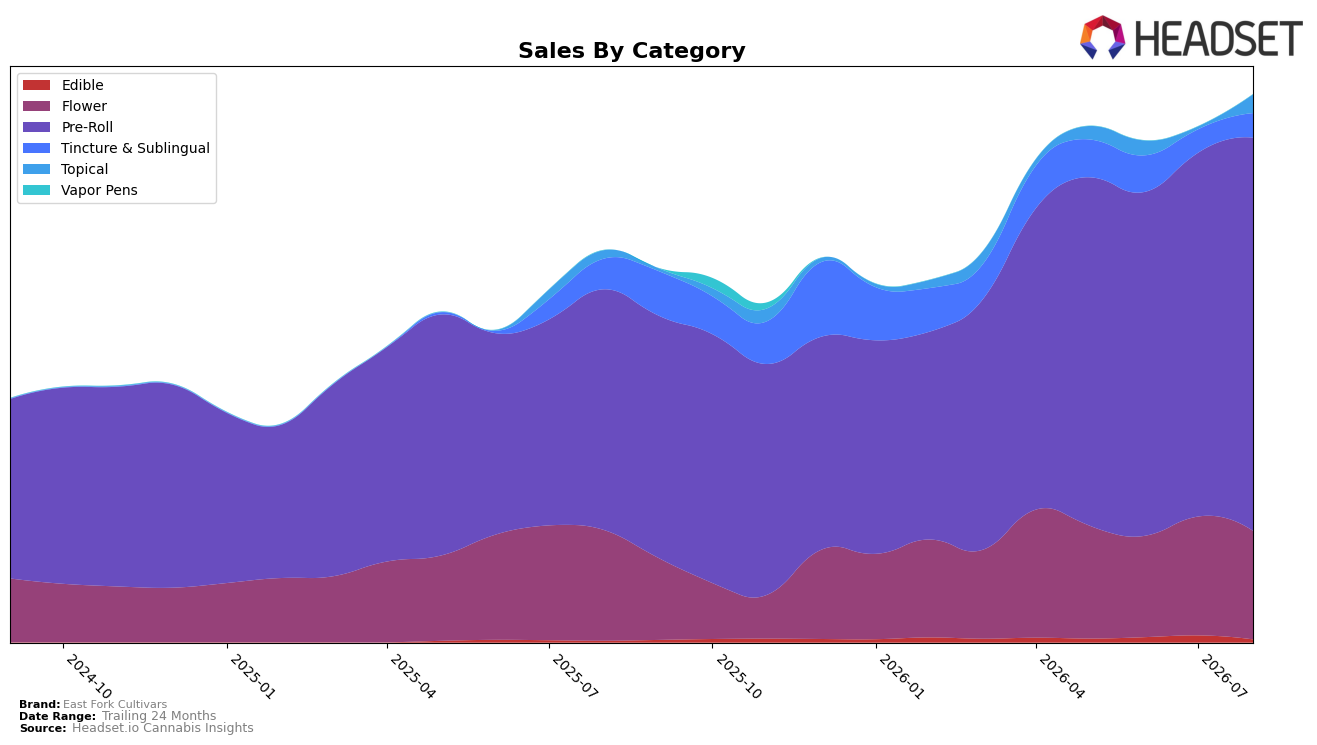
In August 2026, East Fork Cultivars concentrated 71.91% of sales in Pre-Roll, where sales grew 63.51% year over year and 8.15% month over month, while Flower held 19.77% share with a -2.11% YoY contraction and a -8.78% MoM decline. Tincture & Sublingual accounted for 4.42% share with a -20.25% YoY change but a 4.66% MoM lift, and Topical, at 3.37% share, surged 128.09% YoY and 619.53% MoM from a low base; Edible remained marginal at 0.53% share with 88.59% YoY growth but a -57.86% MoM drop. With brand-level sales up 39.91% YoY and average price up 3.39%, the pattern implies a pivot toward higher-velocity Pre-Roll anchoring growth, with opportunistic expansion in Topical offsetting Flower softness.
These shifts suggest a positioning concentrated in value-accessible inhalables supported by selective wellness adjacencies: Pre-Roll’s 71.91% share and an average price of $10.66 place the brand to defend volume, while Flower’s -8.78% MoM slide and -2.11% YoY change signal reduced reliance on bulk formats. The Topical spike of 619.53% MoM alongside 128.09% YoY implies trial-driven channel wins that could diversify risk, whereas Edible’s -57.86% MoM despite 88.59% YoY indicates intermittent placement rather than steady pull. With a Pre-Roll category rank of 20 in Oregon and the top state concentrated in Oregon, the mix implies deeper focus on core Pre-Roll rank improvement and selective nurturing of Topical to stabilize non-inhalable contribution.
Competitive Landscape
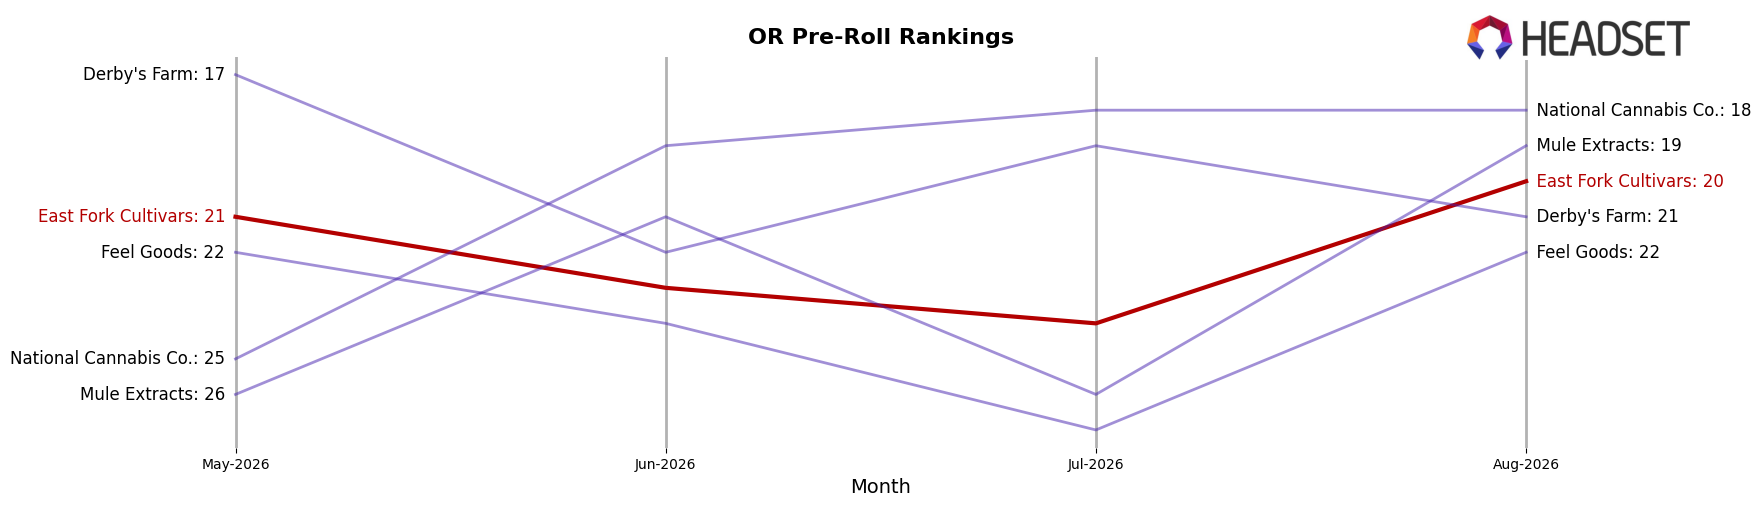
East Fork Cultivars sits at rank 20 in OR Pre-Roll in August 2026, up 14 positions from rank 34 year over year, and up 1 position from rank 21 in May 2026, marking a new peak at rank 20 in August 2026; meanwhile, STiCKS held rank 1 with a flat YoY rank at 1 and a 96.2% YoY sales increase, and Kaprikorn climbed from rank 5 to rank 2 with a 128.9% YoY sales increase, indicating that East Fork Cultivars’ upward rank trajectory is real but paced behind category leaders accelerating faster at the top.
Notable Products
Create - Sasquatch Pre-Roll 7-Pack (3.5g) posted the clearest move in August 2026 with a +153% month-over-month surge to rank 1, while Pineapple Jager Pre-Roll (0.5g) fell 37% to rank 5, indicating shopper trade-up from singles to multi-packs within Pre-Roll. Relax - Blue Orchid Pre-Roll 7-Pack (3.5g) held rank 3 with a roughly flat -5% month-over-month change, and CBD/THC 2:1 Candy Blossom (1g) in Flower climbed 78% to rank 6, which, alongside CBD/THC 2:1 Candy Blossom (Bulk) up 62% to rank 4, signals complementary pull from value and CBD-forward formats. With six of the top ten in Pre-Roll and two of those being 7-Packs in the top three, the assortment is consolidating around pack-size value rather than single half-gram trials, pointing to a strategy that prioritizes basket-building over breadth of SKUs.
Top Selling Cannabis Brands






Data for this report comes from real-time sales reporting by participating cannabis retailers via their point-of-sale systems, which are linked up with Headset’s business intelligence software. Headset’s data is very reliable, as it comes digitally direct from our partner retailers. However, the potential does exist for misreporting in the instance of duplicates, incorrectly classified products, inaccurate entry of products into point-of-sale systems, or even simple human error at the point of purchase. Thus, there is a slight margin of error to consider. Brands listed on this page are ranked in the top twenty within the market and product category by total retail sales volume.

