.svg)

Aug-2026
Sales
Trend
6-Month
Product Count
SKUs
Avg Price
YoY Sales Change
YoY Price Change


Where to Buy
Gud Gardens is stocked at 118 licensed dispensaries across Oregon, with the deepest coverage in Portland, Eugene, Beaverton, Ontario, and Salem. Search by ZIP code or city below to find the closest one, or filter by product type if you are after a specific format.
Market Insights Snapshot
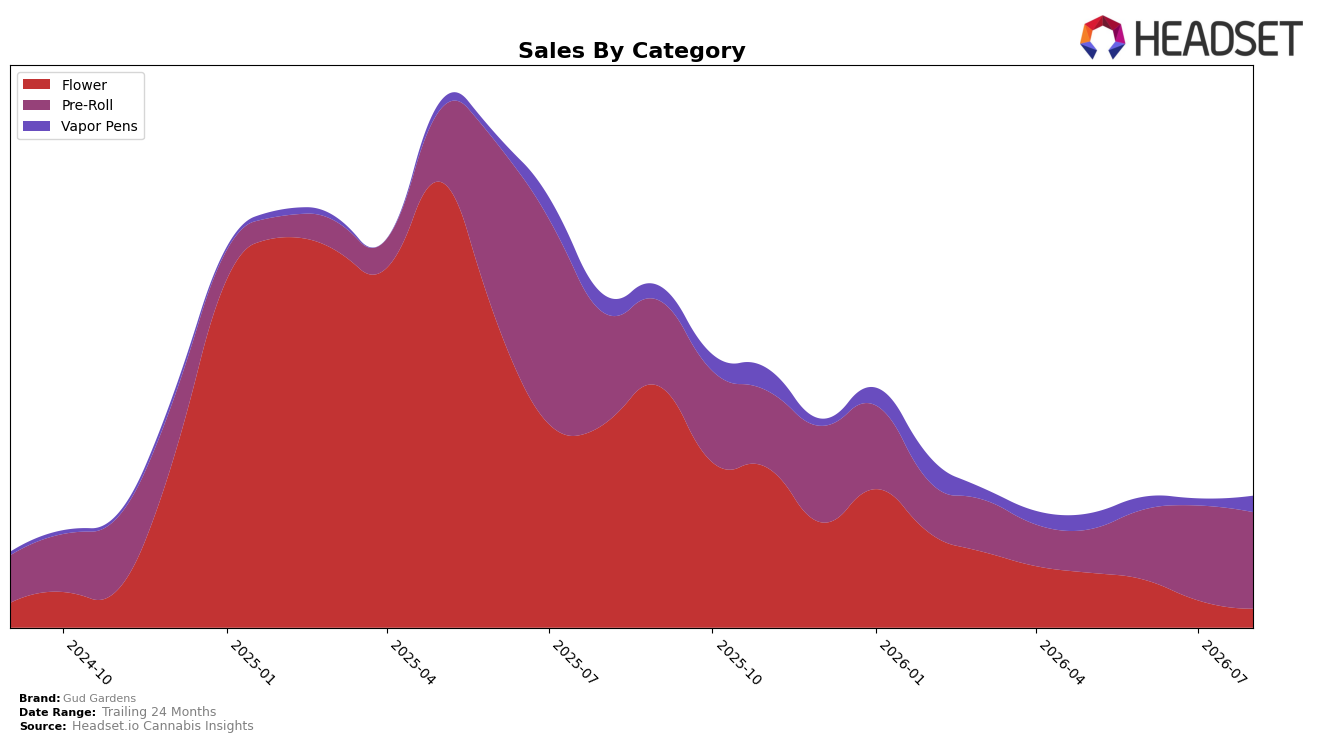
Gud Gardens concentrated 73.48% of August 2026 sales in Pre-Roll, where sales were down 13.24% year over year but up 1.72% month over month, while Vapor Pens rose to 12.25% share with a 139.11% month-over-month jump despite a 9.44% year-over-year decline; Flower contracted to 14.27% share with a 90.81% year-over-year drop and a 30.72% month-over-month decline. With an average price down 20.23% year over year to $12.46 and Pre-Roll anchored at a Oregon category rank of 27, the mix suggests a pivot toward higher-velocity Pre-Rolls and a rebound in Vapor Pens to offset deep Flower retrenchment.
The combination of Pre-Roll steadiness (1.72% MoM) and Vapor Pens acceleration (139.11% MoM) alongside a steep Flower pullback (30.72% MoM) implies Gud Gardens is consolidating around convenience formats where price elasticity can be managed, even as overall sales fell 60.56% year over year. Given 73.48% share in Pre-Roll and a 27th-place rank in Oregon, the path to improved positioning likely depends on continuing to trade consumers from Flower into Vapor Pens and defending Pre-Roll penetration while sustaining price architecture after a 20.23% YoY price decrease.
Competitive Landscape
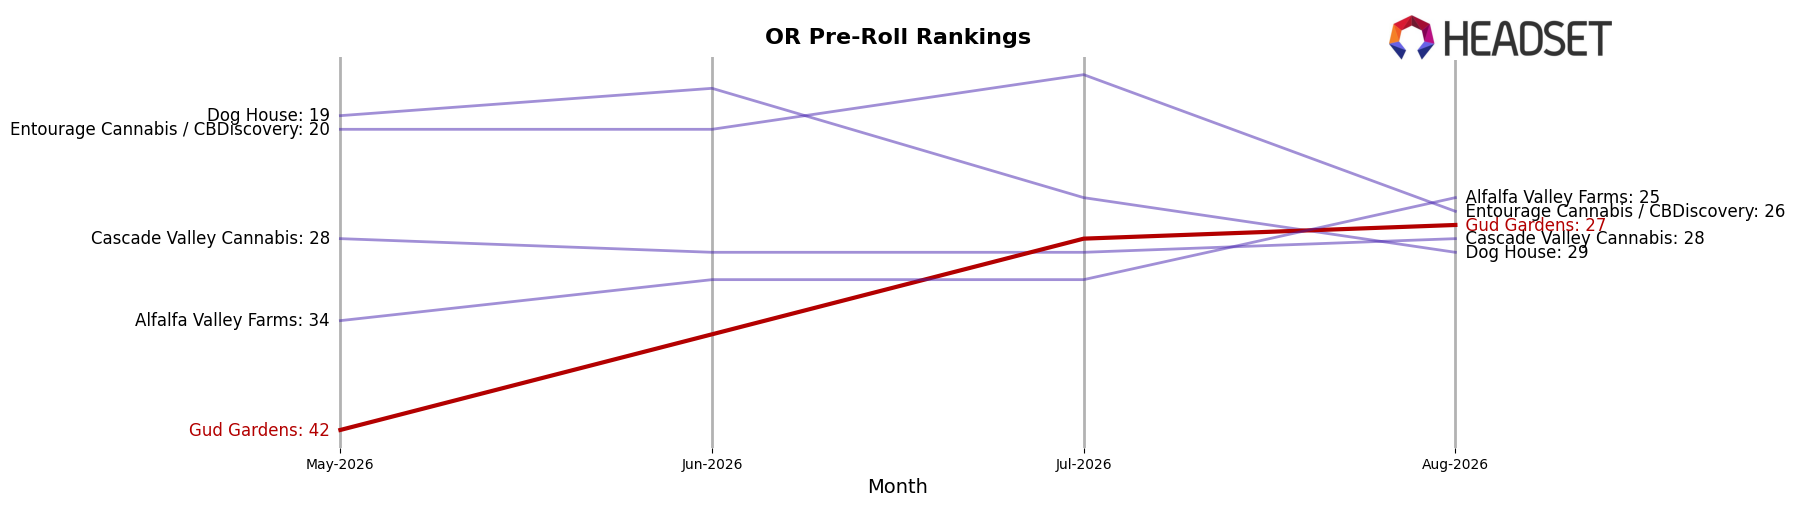
In August 2026, Gud Gardens ranks #27 in OR Pre-Roll, down 3 positions year over year from #24, but up 15 places from #42 in May 2026, indicating a rebound from spring lows despite being well off its #9 peak in July 2025; meanwhile, STiCKS held #1 year over year at #1 while growing sales by 96.2%, and Kaprikorn climbed from #5 to #2 with 128.9% YoY sales growth, outpacing Gud Gardens’ rank movement in both direction and magnitude. The contrast with Hellavated, which slipped from #2 to #3 alongside a 19.9% YoY sales decline, suggests Gud Gardens is competing in a tier where upward mobility depends on sustained gains rather than one-off jumps, and the net pattern—YoY slippage of 3 ranks alongside a 15-rank improvement since May 2026—implies a mid-pack recovery trajectory that requires continued month-over-month momentum to convert into durable top-20 positioning.
Notable Products
Miami Dade (Bulk) posted the steepest decline at -67.3% month over month and slid to rank 6 in August 2026, while Variety Pre-Roll 21-Pack (10.5g) held rank 1 despite a -6.7% pullback. Japanese Mimosa (28g) was the only material mover upward at +50.1% MoM into rank 2, contrasting with Gud Day Pre-Roll 6-Pack (4.8g) at rank 3 with a -26.1% drop. With four of the top five positions occupied by Pre-Roll SKUs and only one Flower SKU gaining sharply, the mix implies a pivot toward defending Pre-Roll share while selectively scaling a single Flower winner.
Top Selling Cannabis Brands






Data for this report comes from real-time sales reporting by participating cannabis retailers via their point-of-sale systems, which are linked up with Headset’s business intelligence software. Headset’s data is very reliable, as it comes digitally direct from our partner retailers. However, the potential does exist for misreporting in the instance of duplicates, incorrectly classified products, inaccurate entry of products into point-of-sale systems, or even simple human error at the point of purchase. Thus, there is a slight margin of error to consider. Brands listed on this page are ranked in the top twenty within the market and product category by total retail sales volume.

