Jun-2026
Sales
Trend
6-Month
Product Count
SKUs
Avg Price
YoY Sales Change
YoY Price Change
Market Insights Snapshot
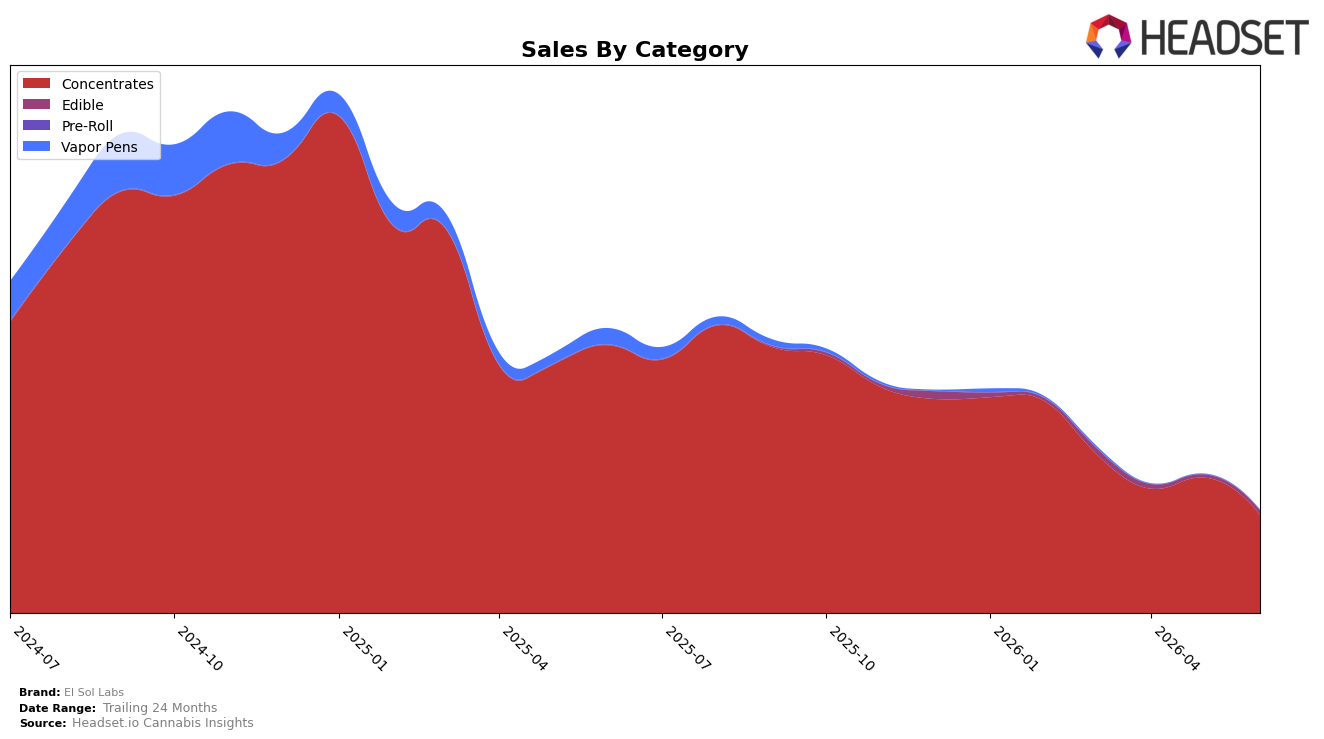
El Sol Labs remained heavily concentrated in Concentrates at 95.99% share in June 2026 while Edible accounted for 4.01%, with Concentrates down 63.47% year over year and 27.63% month over month, and Edible up 50.86% month over month but with no year-over-year baseline reported. Across the portfolio, brand sales were down 64.06% year over year and average price declined 18.04%, while the Concentrates average price sat at $9.81 and Edible at 7.41; the mix implies that month-over-month contraction in the core Concentrates category outweighed Edible’s month-over-month uplift, pushing overall momentum negative despite a lower price point.
Given a 95.99% revenue dependence on Concentrates alongside a June 2026 rank of 30 in Concentrates in Colorado, the mix and rank position indicate vulnerability to further share erosion if category headwinds persist and Edible scaling remains small. The 50.86% month-over-month lift in Edible against a 27.63% month-over-month drop in Concentrates suggests an early pivot opportunity, but with brand sales down 64.06% year over year and the brand’s average price down 18.04%, the pattern implies price-led tactics have not offset volume decline, so positioning hinges on either regaining rank in Concentrates or accelerating Edible to a double-digit share.
Competitive Landscape
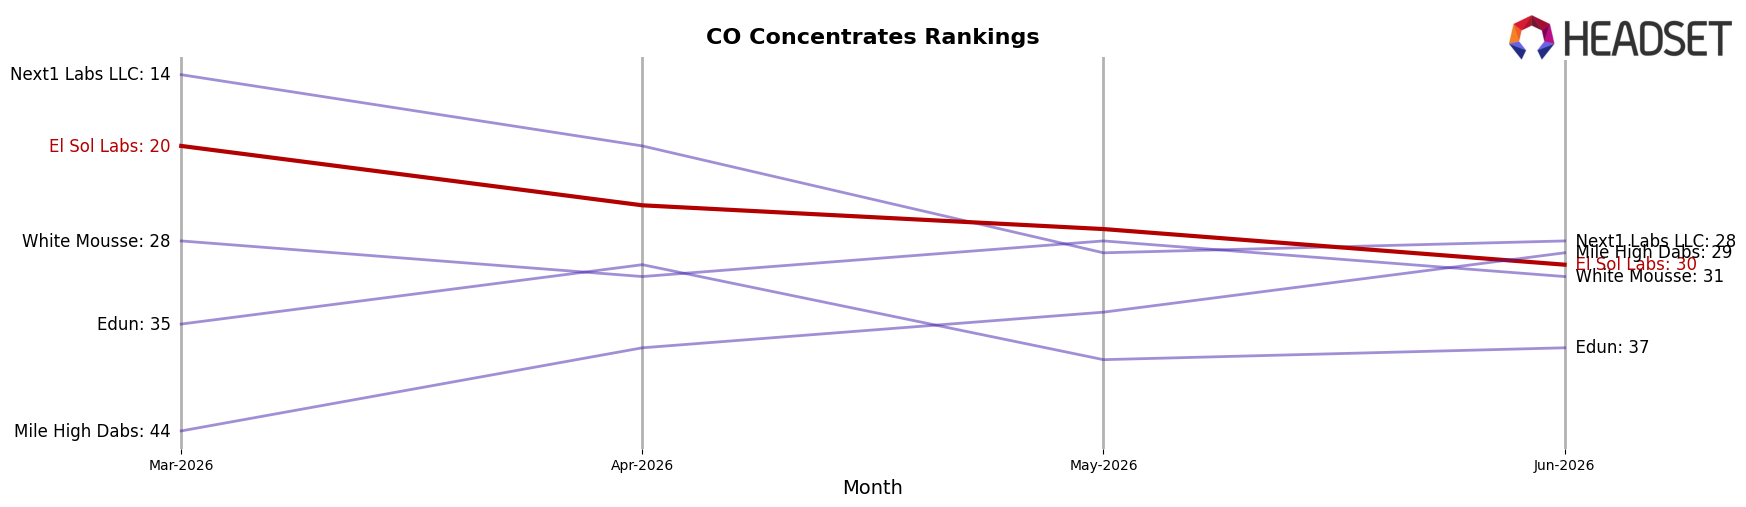
El Sol Labs sits at rank #30 in Colorado Concentrates in June 2026, down 16 positions year over year from #14 and 10 positions below March 2026’s #20, even though the brand’s historical peak was #6 in January 2025; in contrast, Amber holds #1 with a 39.0% year-over-year sales increase while 710 Labs remains #2 amid a -9.9% decline, indicating that El Sol Labs’ double-digit rank erosion against both rising leaders and contracting incumbents points to a share reallocation away from El Sol Labs rather than category-wide softness.
Notable Products
Pending Update Wax (1g) posted the largest month-over-month gain at +68.8% while holding rank 7, signaling an inflection below the top tier where rank 1, rank 2, and rank 3 positions are unchanged at the summit. Midnight Oil Wax (1g) sits at rank 1 and White Willow Wax (1g) at rank 2, preserving a stable top-two even as a lower-ranked SKU outpaced them in growth by more than 60 percentage points. With all top-10 items concentrated in Concentrates and four of the top five residing there, the pattern implies El Sol Labs is doubling down on a depth strategy in a single category while nurturing mid-pack climbers to refresh the lineup.
Top Selling Cannabis Brands
Data for this report comes from real-time sales reporting by participating cannabis retailers via their point-of-sale systems, which are linked up with Headset’s business intelligence software. Headset’s data is very reliable, as it comes digitally direct from our partner retailers. However, the potential does exist for misreporting in the instance of duplicates, incorrectly classified products, inaccurate entry of products into point-of-sale systems, or even simple human error at the point of purchase. Thus, there is a slight margin of error to consider. Brands listed on this page are ranked in the top twenty within the market and product category by total retail sales volume.

