Jun-2026
Sales
Trend
6-Month
Product Count
SKUs
Avg Price
YoY Sales Change
YoY Price Change
Market Insights Snapshot
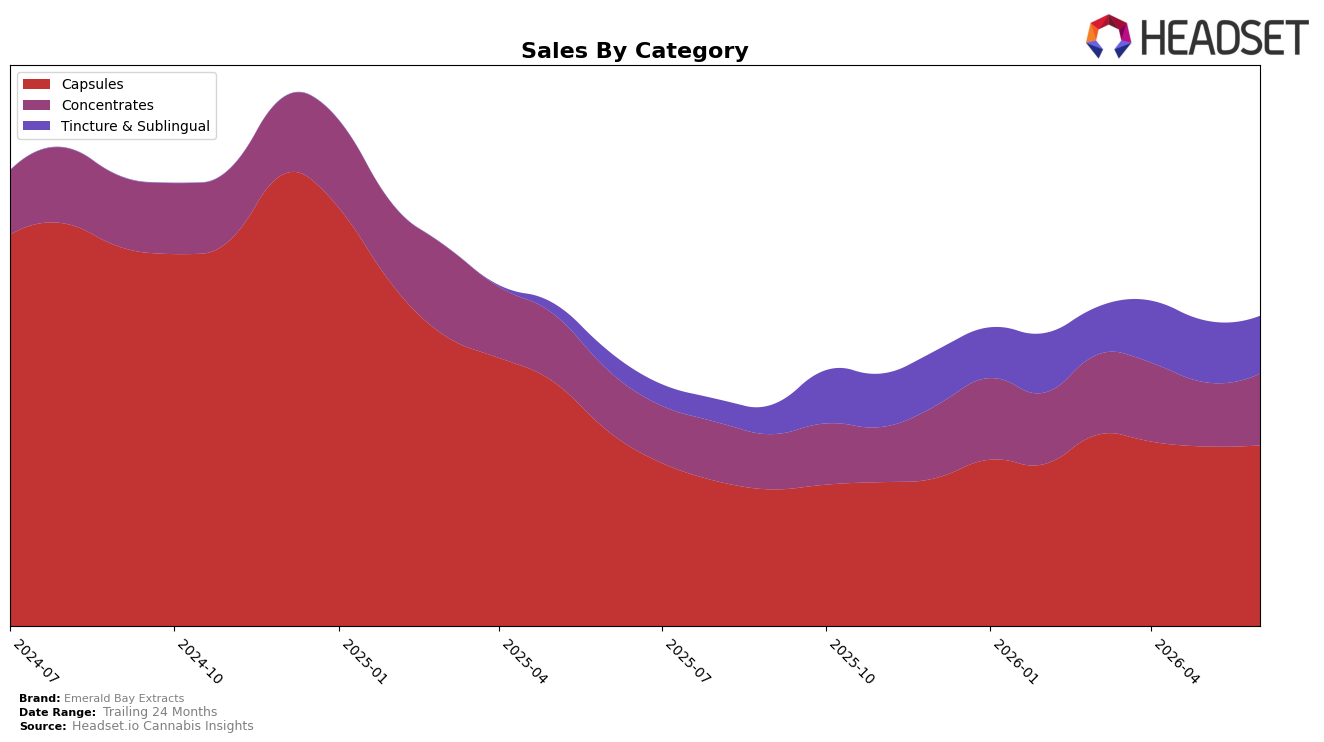
Capsules held 58.39% of Emerald Bay Extracts’ mix in June 2026 with a 0.64% month-over-month uptick but a 7.21% year-over-year decline, while Concentrates rose to 23.03% share on 11.56% MoM and 17.66% YoY growth; Tincture & Sublingual reached 18.58% share despite a 6.55% MoM pullback after a 199.22% YoY surge. With average price down 3.95% YoY to $33.27 and Capsules’ price sitting at 35.64, the brand posted 12.73% YoY sales growth yet remains 30.29% below its 24‑month level, which implies mix-led recovery anchored by Concentrates and Tincture & Sublingual offsetting Capsule contraction.
Positioning in California Capsules at rank 4, alongside a 0.64% MoM lift in that category and an 11.56% MoM gain in Concentrates, suggests Emerald Bay Extracts is trading breadth for depth: maintaining a top-tier Capsules seat while reallocating demand toward faster-growing Concentrates and a newly scaled Tincture & Sublingual base. The combination of a 199.22% YoY expansion in Tincture & Sublingual and a 3.95% YoY price reduction indicates a value-access strategy that widens entry points without eroding the Capsule-led premium, implying near-term share resilience via cross-category traffic while longer-term growth will hinge on sustaining double-digit Concentrates momentum as Capsule share normalizes from 58.39%.
Competitive Landscape
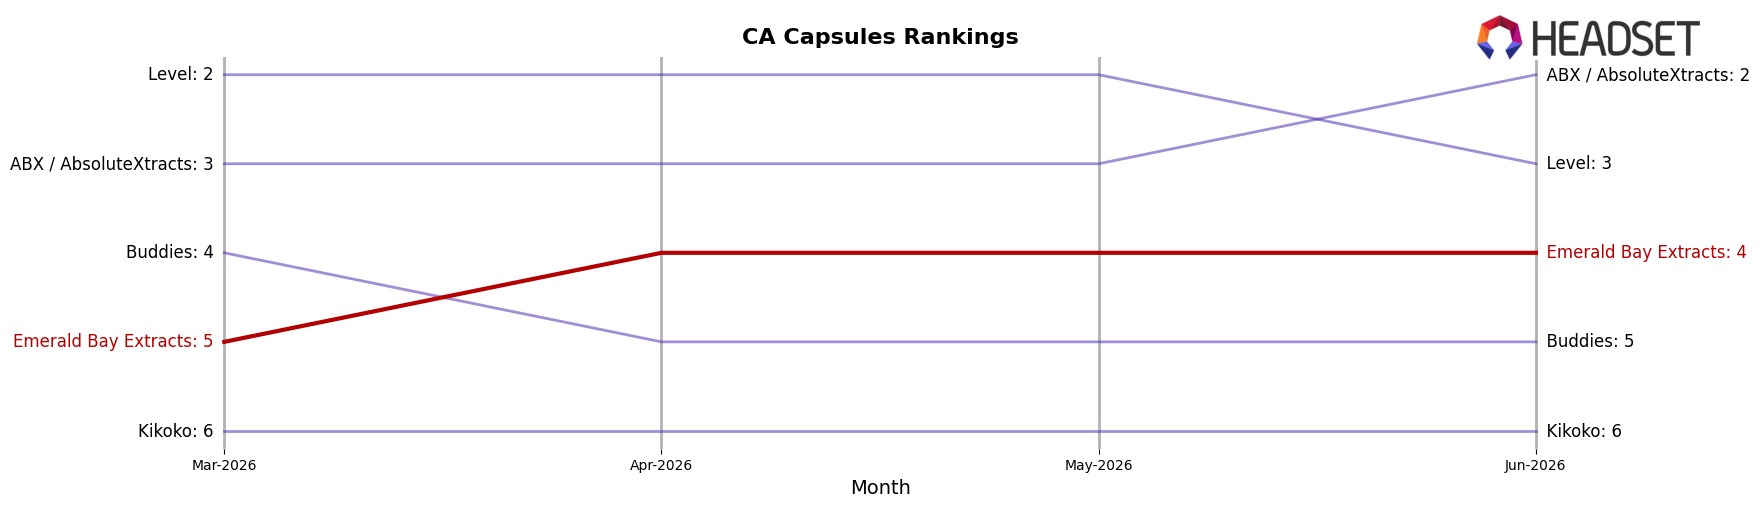
Emerald Bay Extracts sits at rank #4 in CA Capsules in June 2026, improving 1 position YoY from #5 while also moving up 1 place since March 2026, and it remains 1 slot below its peak of #3 from January 2025; meanwhile, Breez advanced from #2 to #1 as its sales fell 37% YoY, and ABX / AbsoluteXtracts climbed from #3 to #2 despite a 23% YoY sales decline, indicating Emerald Bay Extracts is gaining share positionally against higher-ranked peers whose volumes contracted while Buddies rose from #6 to #5 on 30% YoY growth, implying Emerald Bay Extracts’ upward rank trajectory is driven more by relative stability than outsized category expansion and sets a path to retake the #3 slot if peer contraction persists.
Notable Products
Ice Cream Cake RSO Syringe (1g) posted the standout surge with +99.1% month over month to rank 1, while CBD/THC 1:1 Apple Fritter RSO Syringe (1g) fell -10.6% to rank 4. Blue Dream RSO Syringe (1g) rose +50.7% into rank 3, and Capsules held four of the top ten slots in June 2026 even as Strawberry Cough RSO Tablets 20-Pack (1000mg) declined -17.5% at rank 8. The mix points to a pivot toward high-velocity RSO syringes driving the leaderboard, with Capsules acting as a stable but selective volume base.
Top Selling Cannabis Brands
Data for this report comes from real-time sales reporting by participating cannabis retailers via their point-of-sale systems, which are linked up with Headset’s business intelligence software. Headset’s data is very reliable, as it comes digitally direct from our partner retailers. However, the potential does exist for misreporting in the instance of duplicates, incorrectly classified products, inaccurate entry of products into point-of-sale systems, or even simple human error at the point of purchase. Thus, there is a slight margin of error to consider. Brands listed on this page are ranked in the top twenty within the market and product category by total retail sales volume.

