Jun-2026
Sales
Trend
6-Month
Product Count
SKUs
Avg Price
YoY Sales Change
YoY Price Change
Market Insights Snapshot
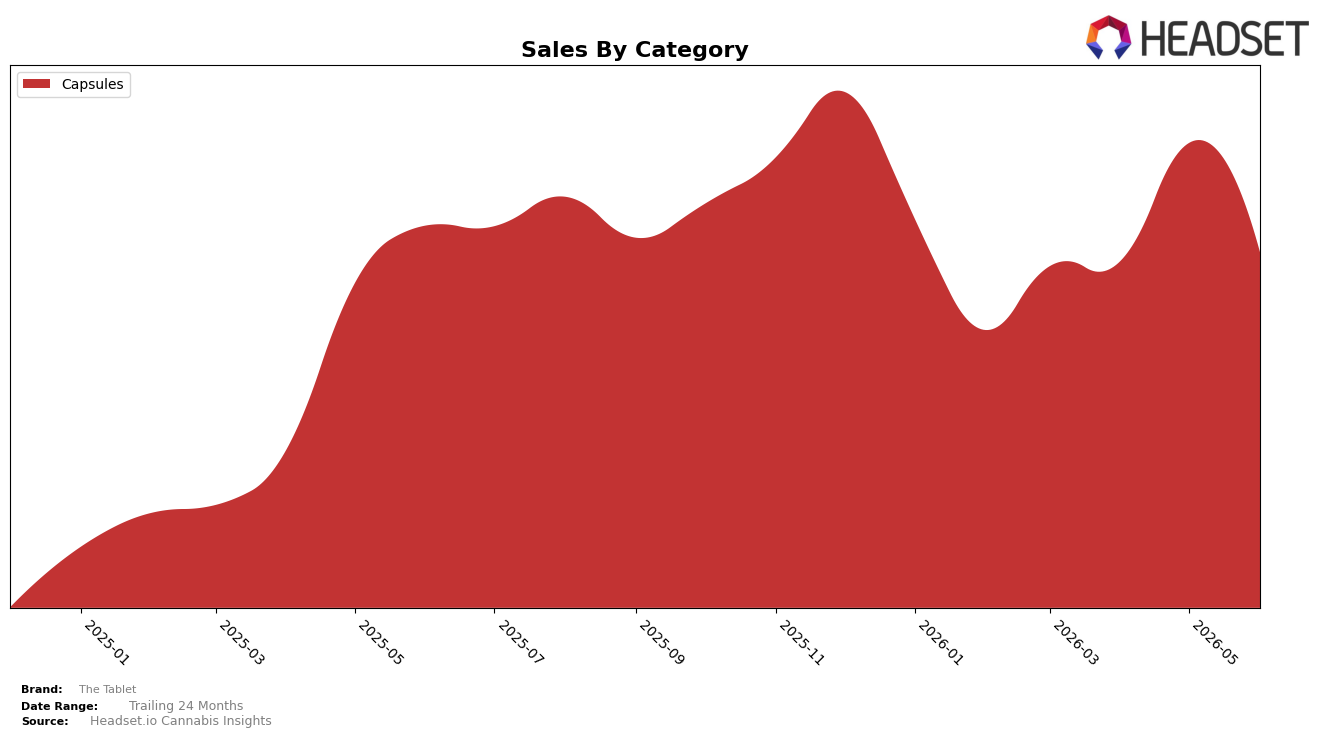
In June 2026, The Tablet operated as a single-category brand with Capsules at 100.0% of mix, posting a year-over-year decline of 6.6% and a month-over-month decline of 22.4%. Average price fell 18.5% YoY to $32.27 while overall brand sales were down 6.6% YoY, and the brand held rank 8 in Capsules in California. The pattern implies that price compression is outpacing unit expansion and that reliance on a one-category footprint magnifies month-to-month volatility.
The combination of an 18.5% YoY price drop against a 6.6% YoY sales decline, plus a 22.4% MoM sales contraction within a 100.0% Capsules mix, points to a positioning anchored in value-seeking Capsule shoppers rather than premium elasticity. Holding rank 8 in Capsules in California while posting a 22.4% MoM step-down suggests exposure to short-cycle promotional swings; the implication is that defending share will require either stabilizing Capsule pricing or adding a second category to smooth volatility and reduce dependence on a single rank position.
Competitive Landscape
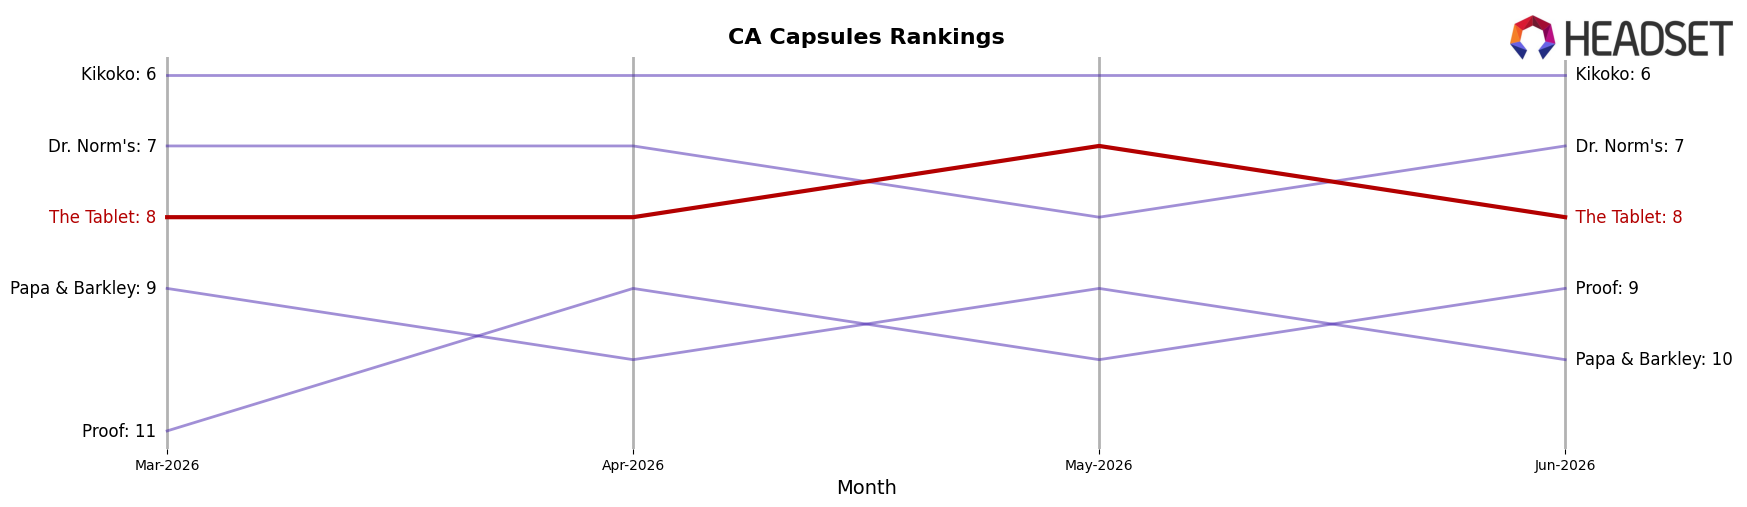
The Tablet sits at #8 in CA Capsules in June 2026, slipping 1 rank from #7 year over year and holding flat versus March 2026 at #8, while its peak of #7 in May 2026 underscores a narrow trading range; meanwhile, Breez moved from #2 to #1 despite a -36.98% YoY sales change and Level fell from #1 to #3 with a -64.53% YoY decline, indicating that top-tier volatility is not translating into upward mobility for The Tablet at #8. With ABX / AbsoluteXtracts improving from #3 to #2 on a -23.27% YoY sales decline and Buddies climbing from #6 to #5 on +29.83% YoY growth, The Tablet’s 1-rank YoY drop amid competitors’ mixed momentum implies a stable but pressured position where lateral movements by leaders cap near-term rank gains.
Notable Products
Indica High Dose Tablets 50-Pack (1000mg) posted the steepest decline at -36.2% MoM while holding rank 3, and Indica Tablets 20-Pack (1000mg) fell -16.7% MoM at rank 4, indicating demand is sliding fastest in higher-dose and Indica SKUs. Sativa High Dose Tablets 50-Pack (1000mg) remained rank 1 despite a -28.6% MoM drop and $44,928 in June 2026 sales, while Sativa Tablets 20-Pack (1000mg) was steadier at -1.6% MoM in rank 2, implying relative resilience for standard-dose Sativa versus sharp pullbacks in high-dose and Indica. With four of the top ten concentrated in Capsules, the mix points to a need to rebalance toward mid-dose offerings where volatility is lower and leadership is more defensible.
Top Selling Cannabis Brands
Data for this report comes from real-time sales reporting by participating cannabis retailers via their point-of-sale systems, which are linked up with Headset’s business intelligence software. Headset’s data is very reliable, as it comes digitally direct from our partner retailers. However, the potential does exist for misreporting in the instance of duplicates, incorrectly classified products, inaccurate entry of products into point-of-sale systems, or even simple human error at the point of purchase. Thus, there is a slight margin of error to consider. Brands listed on this page are ranked in the top twenty within the market and product category by total retail sales volume.

