.svg)


Market Insights Snapshot
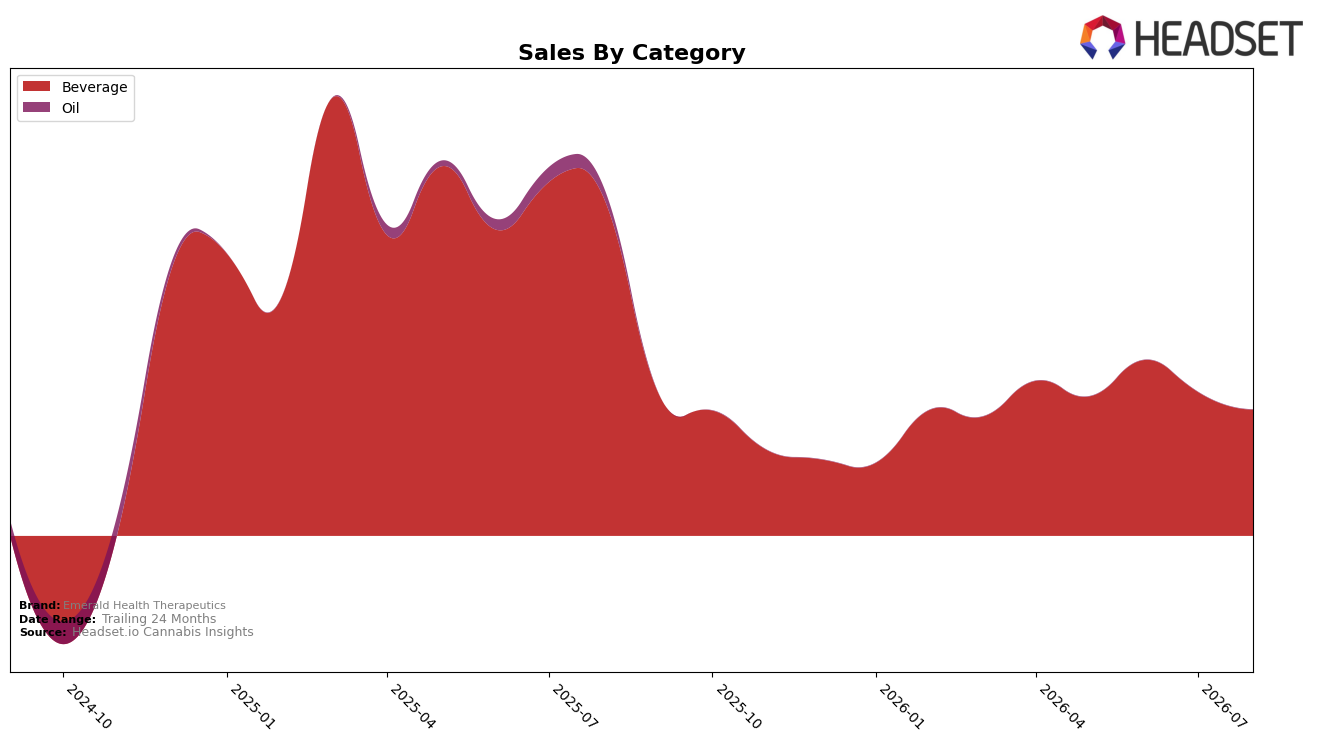
In August 2026, Emerald Health Therapeutics operated as a single-category brand, with Beverage accounting for 100.0% of sales and a month-over-month decline of 12.26% alongside a year-over-year drop of 62.65%. The brand’s average price rose 1.23% year over year to $8.10 while Beverage volume contracted, and overall brand sales were down 63.76% year over year. Concentration entirely in Beverage within Ontario implies exposure to a single demand curve where price firmness and shrinking units coexist, signaling that portfolio breadth is not buffering category-specific downturns.
The shift toward sole reliance on Beverage, paired with a 12.26% month-over-month decline in August 2026 and a 62.65% year-over-year contraction, indicates a positioning centered on value-price Beverage that is not converting to unit growth. With the average price up 1.23% year over year to $8.10 while total brand sales fell 63.76%, Emerald Health Therapeutics is trading into a narrower price band without gaining share from adjacent categories or formats. This pattern implies the brand’s current placement prioritizes maintaining price points over reach, and that diversification or pack/size engineering within Beverage is required to mitigate volume erosion under category-specific headwinds in Ontario.
Competitive Landscape
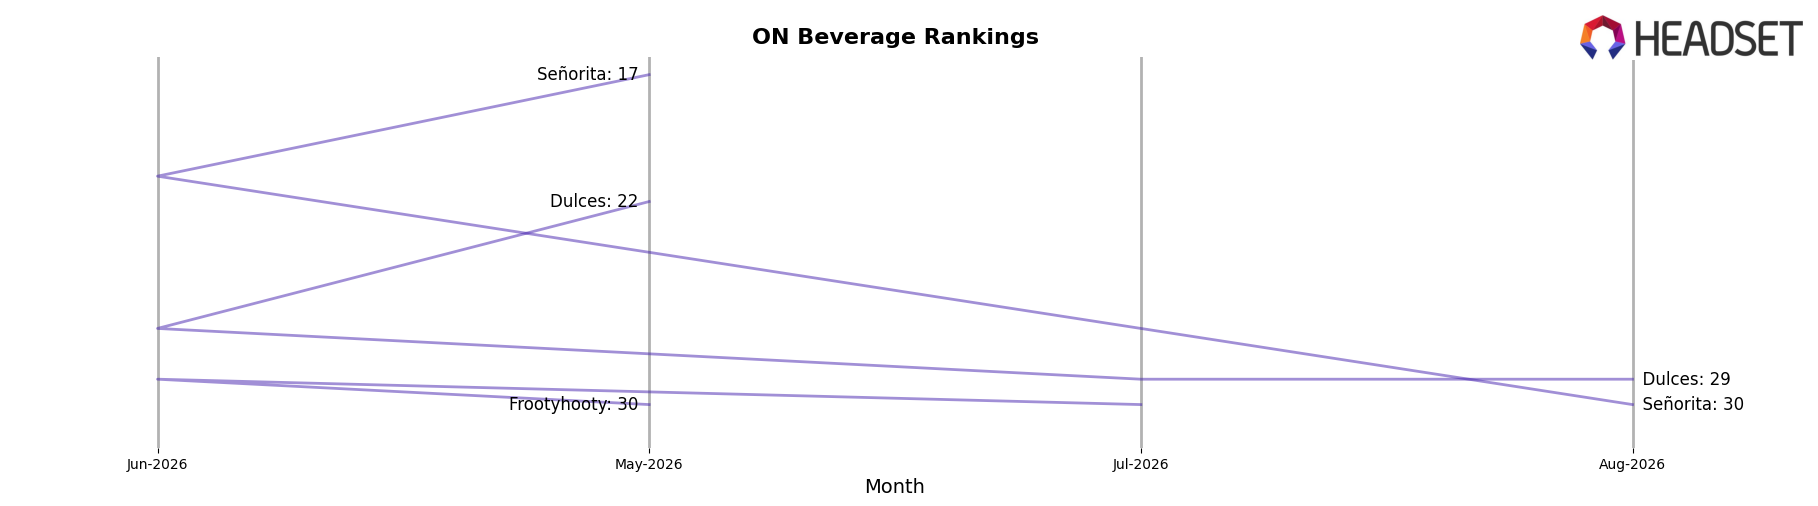
Emerald Health Therapeutics is currently ranked #32 in ON Beverage in August 2026, down 8 positions year over year from #24, and flat versus three months ago at #32; the brand’s prior peak was #23 in March 2025, placing today’s position 9 ranks below that high. In contrast, XMG held #1 both this year and last year despite a -31.4% sales YoY decline, while Versus improved from #3 to #2 with +7.0% sales YoY, and Mollo slipped from #2 to #3 with -13.8% sales YoY; this mix of a stable leader, a climber, and a decliner indicates Emerald Health Therapeutics is losing rank share without offsetting momentum from competitor turbulence, implying its trajectory points toward further mid-pack stagnation unless relative velocity improves.
Notable Products
Lime Mint Beverage (10mg THC, 222ml) posted the steepest decline in August 2026 with a -30.8% MoM drop and slid to rank 2, while Ginger Lime Live Rosin Beverage (10mg THC, 222ml) rose +15.7% MoM to rank 1. With both top-2 positions occupied by Beverage SKUs, the category concentration signals reliance on drinkables even as one flagship contracts sharply. The pattern implies Emerald Health Therapeutics is leaning into beverages but must balance portfolio risk as momentum consolidates in a single rising SKU.
Top Selling Cannabis Brands






Data for this report comes from real-time sales reporting by participating cannabis retailers via their point-of-sale systems, which are linked up with Headset’s business intelligence software. Headset’s data is very reliable, as it comes digitally direct from our partner retailers. However, the potential does exist for misreporting in the instance of duplicates, incorrectly classified products, inaccurate entry of products into point-of-sale systems, or even simple human error at the point of purchase. Thus, there is a slight margin of error to consider. Brands listed on this page are ranked in the top twenty within the market and product category by total retail sales volume.

