Market Insights Snapshot
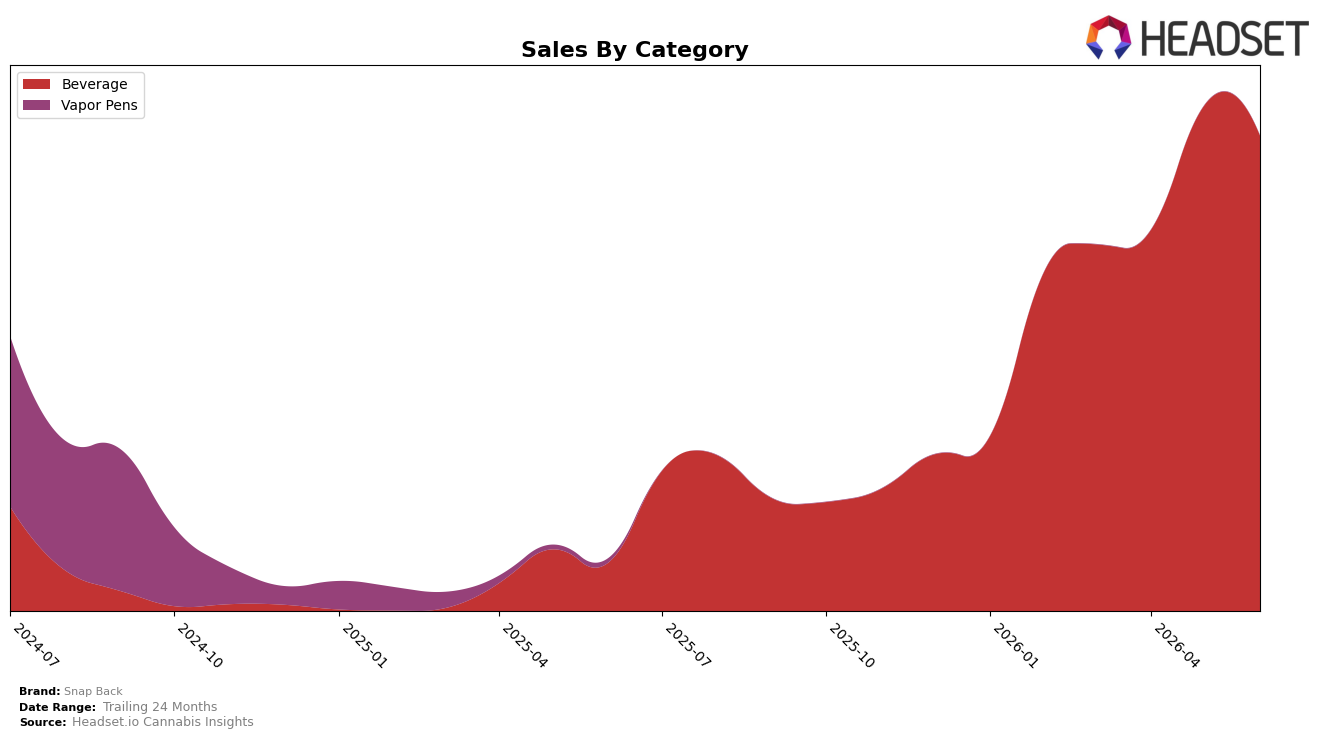
In June 2026, Snap Back’s category mix is fully concentrated in Beverage at 100.0% share, with Beverage sales up 891.47% year over year but down 6.07% month over month, while average price fell 12.77% YoY to $6.79. Overall brand sales grew 812.70% YoY as Beverage carried the entire mix, and the brand held rank 14 in Beverage in Alberta, indicating gains on a yearly basis alongside a short-term pullback on a monthly basis. The pattern implies a single-category scale-up where rapid annual gains coexist with near-term moderation, suggesting growth is volume-led at a lower price point and exposed to month-level volatility due to lack of category diversification.
With Beverage at 100.0% of sales and rank 14 in Alberta, the 6.07% MoM dip alongside an 891.47% YoY surge implies sensitivity to month-over-month demand swings but improving annual relevance within the category. The 12.77% YoY price decline paired with 812.70% YoY brand growth indicates a trade-up in unit velocity driven by lower pricing rather than mix expansion, and the absence of non-Beverage revenue suggests positioning as a price-competitive Beverage specialist rather than a portfolio player; this implies share gains can continue if velocity offsets price compression, but rank mobility will hinge on stabilizing monthly comps within Beverage.
Competitive Landscape
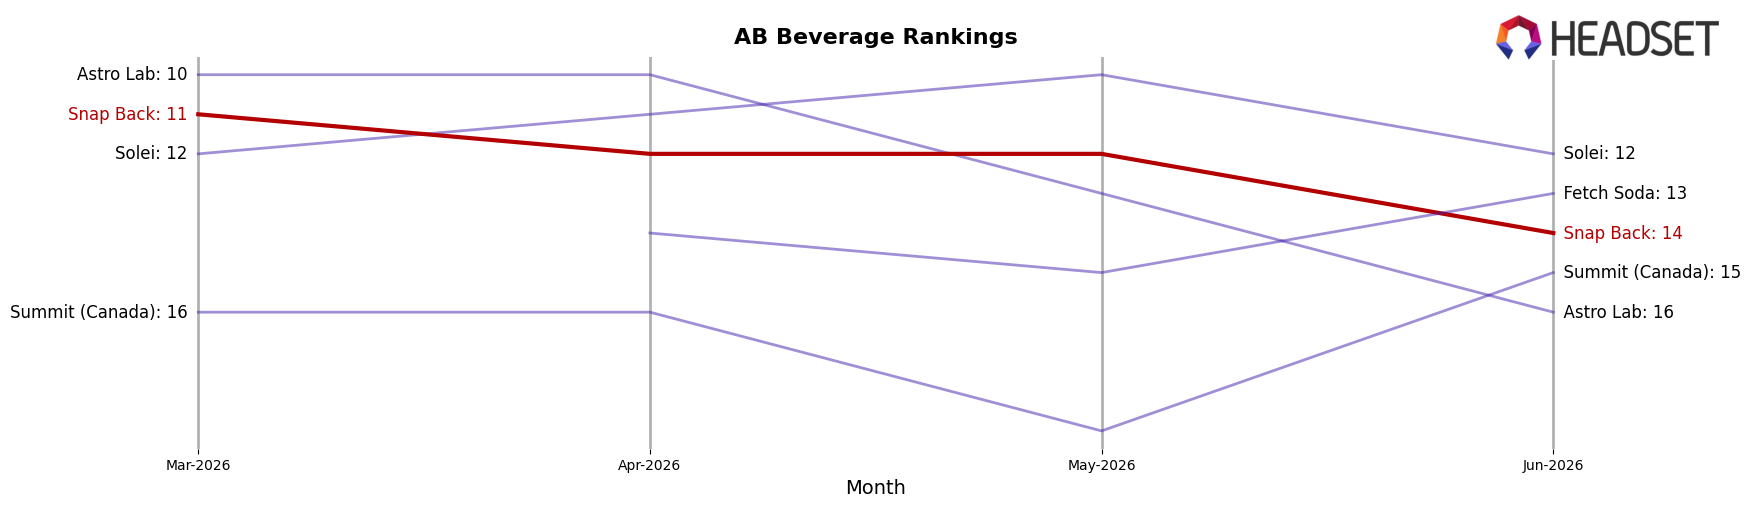
Snap Back sits at #14 in AB Beverage in June 2026 with no year-over-year rank reported, sliding from #11 in March 2026 and down 3 positions versus the 3-month mark, while category leaders moved in opposite directions: XMG held #1 despite a -18.9% YoY sales change and Mary Jones climbed from #4 to #2 on 177.5% YoY growth. Two additional risers, Bubble Kush advancing from #7 to #4 with 62.4% YoY growth and Sense & Purpose Beverages moving from #8 to #5 with 65.0% YoY, indicate mid-pack acceleration where Snap Back lost 3 ranks from March 2026 to June 2026; the pattern implies that without a catalyst matching competitor gains, Snap Back’s trajectory points toward further share compression rather than a return to its #11 peak.
Notable Products
Blackberry Creamsicle Rosin Soda (10mg THC, 12oz, 355ml) posted a 152.3% month-over-month surge to rank 4 in June 2026, while Blackberry Vanilla Cream Soda (10mg THC, 355ml) fell 27.0% to rank 2. Strawberry Vanilla Cream Soda (10mg THC, 12oz, 355ml) held rank 1 despite a 6.0% decline, with approximately $20,661 in sales anchoring the lineup. With all top-4 SKUs in Beverages and three cream-soda variants in the top tier, the pattern implies Snap Back is shifting mix toward differentiated rosin formulations without abandoning its vanilla-led core.
Top Selling Cannabis Brands
Data for this report comes from real-time sales reporting by participating cannabis retailers via their point-of-sale systems, which are linked up with Headset’s business intelligence software. Headset’s data is very reliable, as it comes digitally direct from our partner retailers. However, the potential does exist for misreporting in the instance of duplicates, incorrectly classified products, inaccurate entry of products into point-of-sale systems, or even simple human error at the point of purchase. Thus, there is a slight margin of error to consider. Brands listed on this page are ranked in the top twenty within the market and product category by total retail sales volume.

