


Where to Buy
Escape Velocity is stocked at 36 licensed dispensaries across Missouri, with the deepest coverage in Kansas City, Columbia, St. Louis, Branson, and Blue Springs. Search by ZIP code or city below to find the closest one, or filter by product type if you are after a specific format.
Market Insights Snapshot
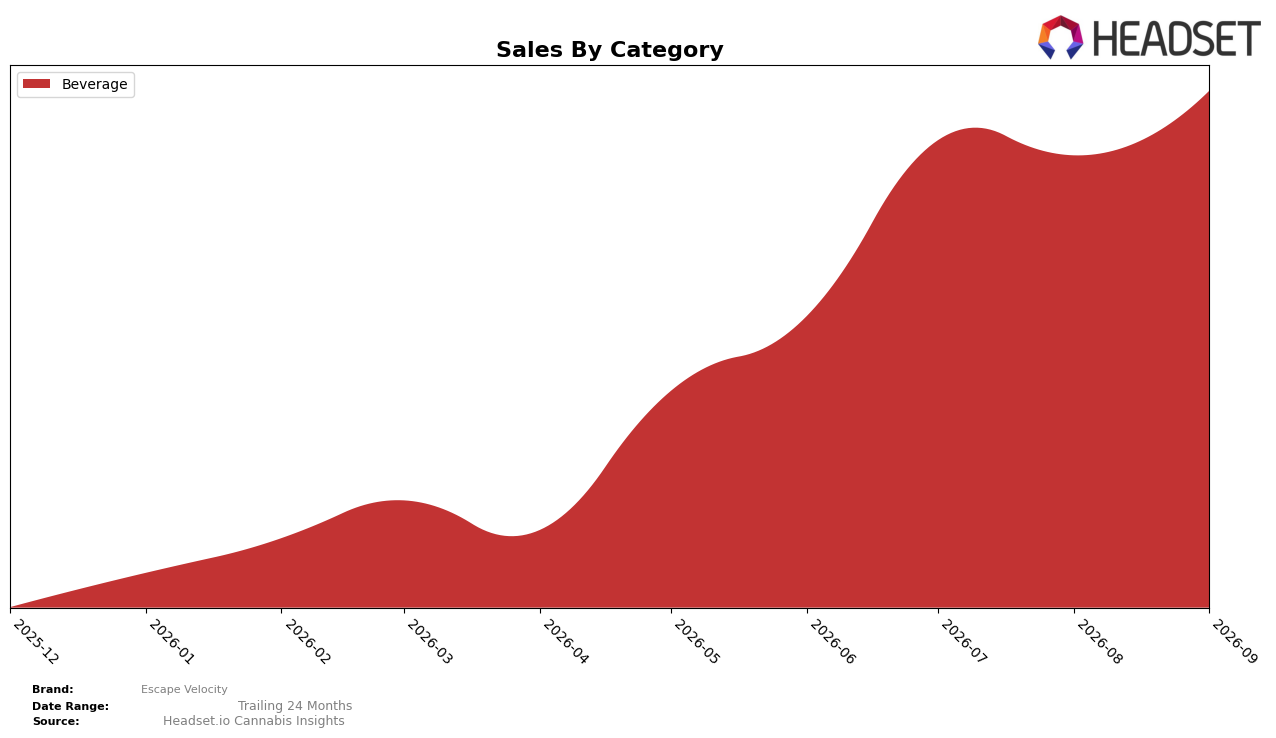
In September 2026, Escape Velocity operated as a single-category brand with Beverage at 100.0% of mix and a month-over-month change of 13.98%, while average price held at $10.91. Within the Beverage context in Missouri, the brand sat at rank 12, a position that, paired with a full 100.0% category concentration and a double-digit MoM lift, implies momentum is being driven by depth rather than breadth.
The combination of a 13.98% MoM uptick alongside a fixed 100.0% category share and a rank of 12 in Missouri suggests Escape Velocity is leaning into Beverage specialization to climb the mid-table. The pattern implies that maintaining a tight focus while nudging rank upward from 12 will likely require either incremental price optimization around the $10.91 level or mix-expansion experiments within Beverage sub-segments, because concentration at 100.0% reduces diversification benefits but directs all gains toward rank mobility.
Competitive Landscape
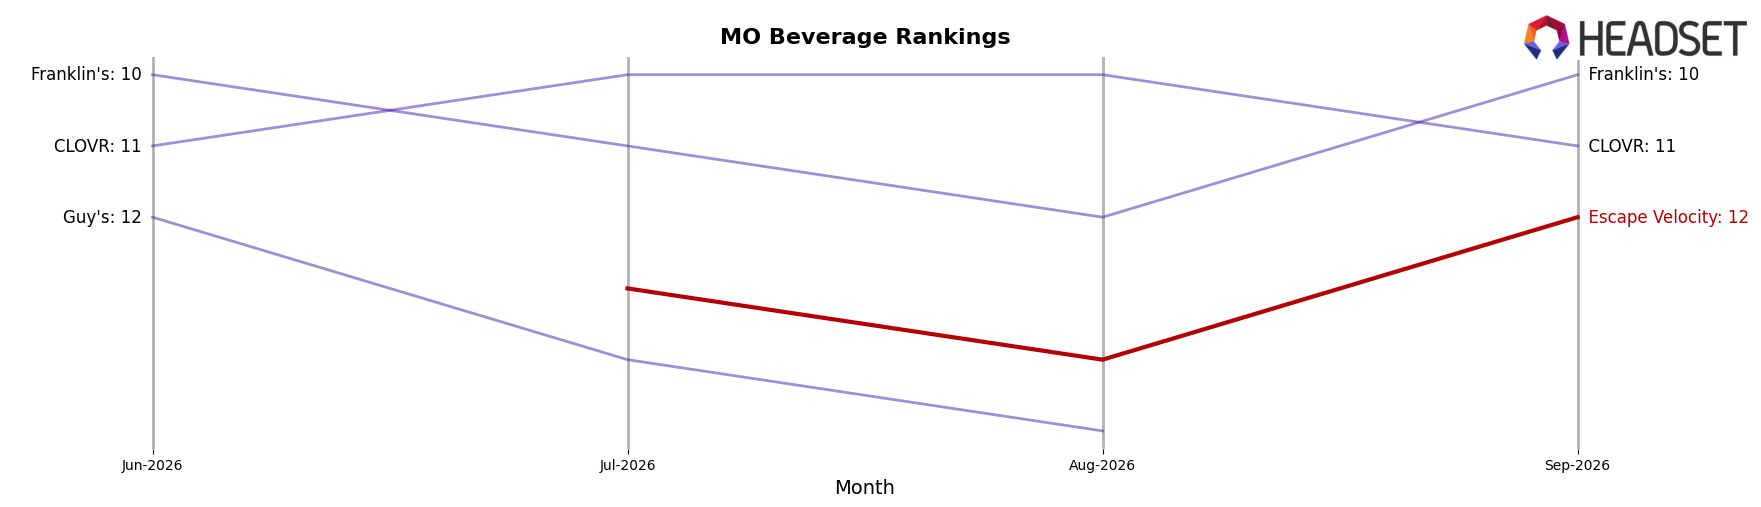
Escape Velocity sits at #12 in MO Beverage in September 2026, up 2 ranks from #14 in June 2026, while year-over-year rank is unavailable and thus not comparable; this #12 also marks its peak rank to date in September 2026, indicating a ceiling test even as the broader ladder is crowded. In contrast, Keef Cola held #1 both this year and last despite a -8.1% YoY sales change, and Canna Cantina climbed to #2 with a +7 position YoY shift alongside +173.6% sales growth, suggesting the top tier is consolidating faster than mid-pack brands can catch up. Illicit / Illicit Gardens at #3 improved 2 ranks YoY with +40.9% sales, while Escape Velocity’s move from #14 to #12 over three months narrows distance but does not breach the top 10, implying that without acceleration beyond a 2-rank quarterly gain, the brand risks stalling below the threshold where share compounding typically begins.
Notable Products
Black Cherry Infused Shot (17mg THC, 2oz, 60ml) posted the largest move in September 2026 with +101.4% month over month to rank 3, while Grape Comet Infused Shot (100mg THC, 2oz, 60ml) climbed +95.1% to rank 1. In contrast, Strawberry Fusion Shot (100mg THC, 2oz, 60ml) fell -15.0% at rank 2 and Tropic Nova Infused Shot (20mg THC, 2oz, 60ml) dropped -40.6% at rank 5. Eight of the top ten are 100mg or sub-20mg Beverage shots, indicating a split demand curve where high-dose leaders gain rank even as select low-dose variants retreat; this mix points to Escape Velocity leaning into high-potency formats with select flavor-driven exceptions.
Top Selling Cannabis Brands


Data for this report comes from real-time sales reporting by participating cannabis retailers via their point-of-sale systems, which are linked up with Headset’s business intelligence software. Headset’s data is very reliable, as it comes digitally direct from our partner retailers. However, the potential does exist for misreporting in the instance of duplicates, incorrectly classified products, inaccurate entry of products into point-of-sale systems, or even simple human error at the point of purchase. Thus, there is a slight margin of error to consider. Brands listed on this page are ranked in the top twenty within the market and product category by total retail sales volume.

