.svg)


Where to Buy
Flight Bites is stocked at 77 licensed dispensaries across New Mexico and Nevada, 54 of them in New Mexico, with the deepest coverage in Albuquerque, Sunland Park, Hobbs, Las Cruces, and Alamogordo. Search by ZIP code or city below to find the closest one.
Market Insights Snapshot
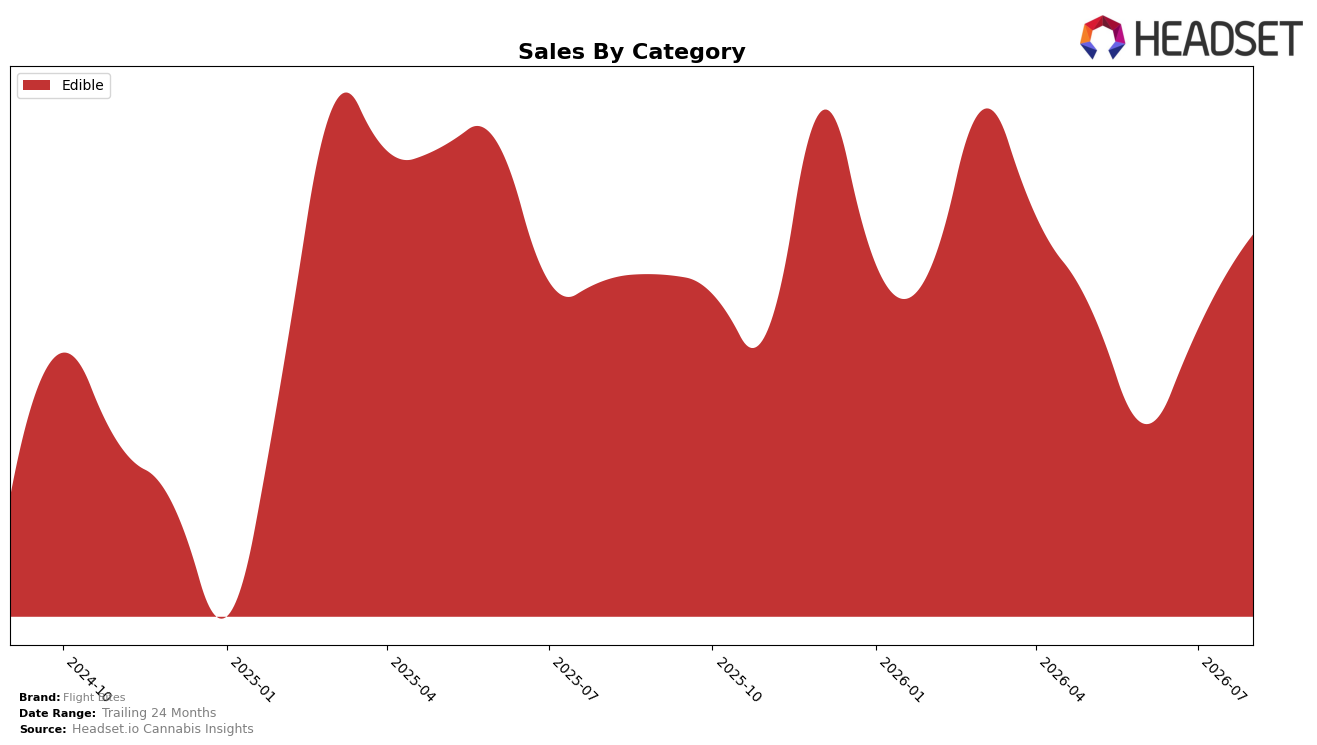
In August 2026, Flight Bites operated as a single-category brand with Edible at 100.0% of sales share, posting year-over-year growth of 8.38% and month-over-month growth of 18.78%. Within the Nevada Edible context, the brand held rank 16 while average price rose 3.80% year over year to $22.96, indicating mix stability rather than a multi-category shift. The pattern implies a concentrated strategy where all incremental volume is tied to Edible, so the 8.38% YoY lift paired with an 18.78% MoM spike suggests episodic demand capture without diversification risk buffering.
Because the full mix is in Edible at 100.0% share and rank stands at 16 in Nevada, the 18.78% MoM surge alongside an 8.38% YoY gain indicates reliance on short-cycle activation within a mid-tier rank band rather than cross-category expansion. With average price up 3.80% YoY to $22.96 while total sales rose 8.38% YoY, the gap points to unit growth outpacing pricing, implying that Flight Bites’ positioning leans on volume-led share defense in Edible and leaves headroom to climb from rank 16 if MoM gains convert to sustained, year-over-year share accretion.
Competitive Landscape
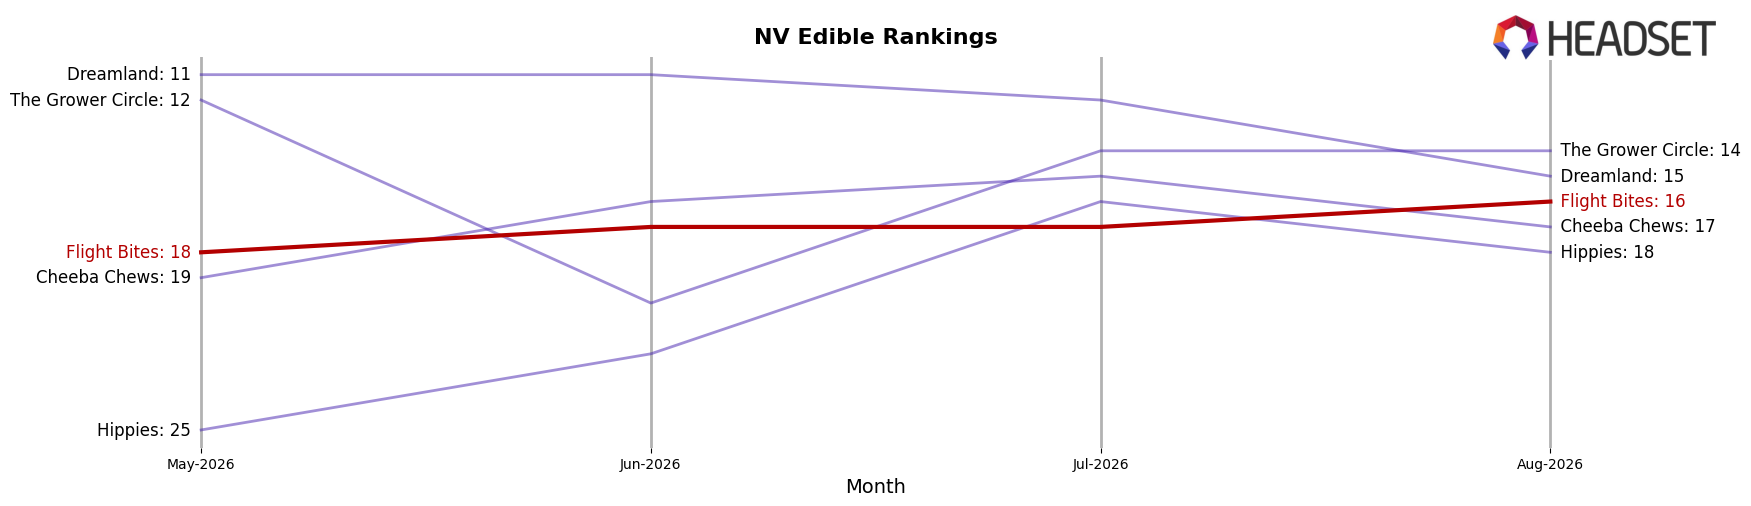
Flight Bites is ranked #16 in NV Edible in August 2026, improving 1 position year over year from #17 and up 2 ranks from #18 three months prior, while still trailing its April 2026 peak of #15; this places the brand amid mixed competitor momentum, as Kanha / Sunderstorm surged from #10 to #3 on 201.9% YoY sales growth and HaHa slipped from #3 to #5 with a 49.8% YoY decline. Meanwhile, category leaders held position but diverged on velocity, with Wyld steady at #1 despite a 15.5% YoY sales contraction and Incredibles stable at #2 with a smaller 7.2% YoY decline; alongside this, Kanha / Sunderstorm outpaced both leaders directionally by climbing 7 ranks year over year while they held flat. The pattern implies Flight Bites’ modest rank gains amid rapid reshuffling above it signal a mid-tier foothold that can advance only if it converts stability into share capture against flat-but-declining incumbents and a fast-rising challenger.
Notable Products
S'mores Gummies 10-Pack (100mg) delivered the headline move with a 467% month-over-month surge to $18,388 and jumped to rank 1, while Strawberry Shortcake Live Rosin Gummies 10-Pack (100mg) also spiked 304% to rank 3. In contrast, Mango Tajin Gummies 10-Pack (100mg) fell 33% and slipped to rank 2, and Strawnana Rosin Gummies 10-Pack (100mg) dropped 75% to rank 6. Seven of the top eight SKUs are Edible gummies in 10-Pack (100mg) formats, and S'mores Rosin Gummies 10-Pack (100mg) climbed 92% to rank 7. The pattern points to a pivot toward indulgent flavor profiles and novelty variants that can rapidly swing share, indicating Flight Bites is leaning into hit-driven edible innovation over steady legacy runners.
Top Selling Cannabis Brands






Data for this report comes from real-time sales reporting by participating cannabis retailers via their point-of-sale systems, which are linked up with Headset’s business intelligence software. Headset’s data is very reliable, as it comes digitally direct from our partner retailers. However, the potential does exist for misreporting in the instance of duplicates, incorrectly classified products, inaccurate entry of products into point-of-sale systems, or even simple human error at the point of purchase. Thus, there is a slight margin of error to consider. Brands listed on this page are ranked in the top twenty within the market and product category by total retail sales volume.

