.svg)


Where to Buy
Mischief is stocked at 20 licensed dispensaries across Minnesota, Michigan, and Colorado, 15 of them in Minnesota, with the deepest coverage in Minneapolis, Saint Paul, Andover, Anoka, and Brooklyn Park. Search by ZIP code or city below to find the closest one, or filter by product type if you are after a specific format.
Market Insights Snapshot
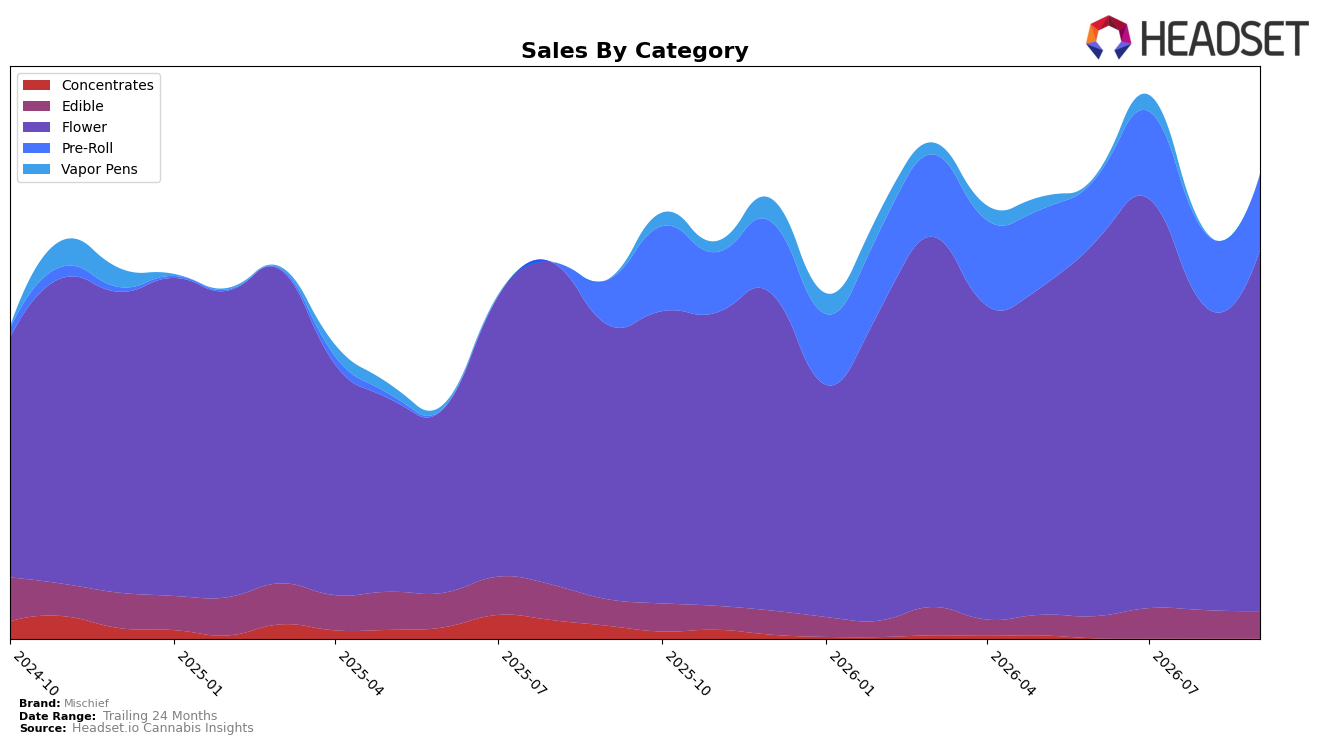
Mischief concentrated 77.84% of September 2026 sales in Flower, up 18.80% month over month and 31.69% year over year, while Pre-Roll held 16.20% share with 2.34% MoM and 66.63% YoY growth; Edible at 5.87% share slipped -3.72% MoM but rose 4.27% YoY, and Vapor Pens fell -75.99% MoM to 0.08% share with no YoY baseline. The brand ranked 8 in Flower in Michigan, and the overall brand posted 29.46% YoY sales growth alongside a -36.32% YoY average price change, implying volume-led gains anchored in Flower while secondary formats either expand at a slower base (Edible) or contract sharply (Vapor Pens), consolidating category reliance rather than diversifying mix.
The shift toward higher Flower and Pre-Roll velocity—18.80% MoM in Flower and 2.34% MoM in Pre-Roll—paired with a -36.32% YoY average price indicates a trade-down effect boosting unit throughput, improving share capture in value-sensitive segments while limiting premium-tier margin upside; the 8th-place Flower rank in Michigan and 66.63% YoY growth in Pre-Roll suggest reinforcement of combustion-centric positioning over ingestibles, where Edible’s -3.72% MoM signals soft repeat. This pattern implies Mischief’s near-term edge rests on sustaining Flower share above 75% while using Pre-Roll’s faster YoY clip to hedge seasonal volatility, with Vapor Pens’ 0.08% share and -75.99% MoM signaling limited ROI for further investment absent repositioning.
Competitive Landscape
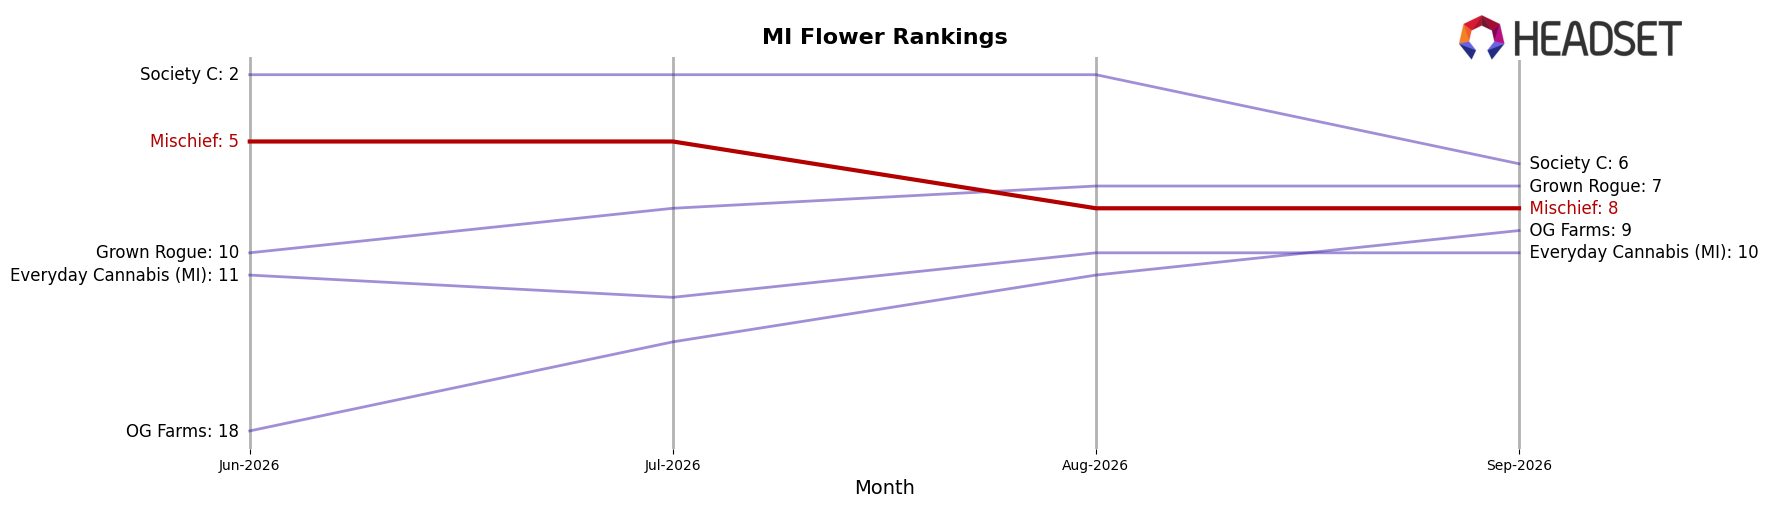
Mischief sits at rank #8 in MI Flower in September 2026, up 2 positions year over year from #10 but down 3 spots from its July 2026 peak at #5, indicating a short-term slippage despite a longer-term climb; meanwhile, Play Cannabis moved to #2 from #7 year over year with 33.3% sales growth while Mischief ceded rank since July 2026, and NOBO advanced to #4 from #19 with 188.3% sales growth as High Minded held #1 despite a 3.3% sales decline, together suggesting Mischief’s YoY rank improvement is being outpaced by faster climbers and the brand must convert mid-summer rank momentum into sustained share defense.
Notable Products
Blue Dream Infused Pre-Roll (1g) posted a 208% month-over-month jump to rank 1 in September 2026, while Purple Kush Infused Pre-Roll (1g) slid 23% to rank 7, and Trop Runtz Pre-Roll (1g) rose 76% at rank 3. Pre-Rolls occupy 6 of the top 10 slots, with Pineapple Express Infused Pre-Roll (1g) up 22% at rank 2 and the category’s lead SKU generating $102,819, which indicates a tilt toward infused formats over flat edibles where Sour Razz Gummies 10-Pack (200mg) dipped 1% at rank 6. The mix implies Mischief is concentrating momentum in a narrow set of high-velocity infused Pre-Rolls, signaling allocation toward SKUs that can compound share quickly while deprioritizing lagging edibles.
Top Selling Cannabis Brands






Data for this report comes from real-time sales reporting by participating cannabis retailers via their point-of-sale systems, which are linked up with Headset’s business intelligence software. Headset’s data is very reliable, as it comes digitally direct from our partner retailers. However, the potential does exist for misreporting in the instance of duplicates, incorrectly classified products, inaccurate entry of products into point-of-sale systems, or even simple human error at the point of purchase. Thus, there is a slight margin of error to consider. Brands listed on this page are ranked in the top twenty within the market and product category by total retail sales volume.

