.svg)
Sep-2026
Sales
Trend
6-Month
Product Count
SKUs
Avg Price
YoY Sales Change
YoY Price Change


Where to Buy
Glorious Cannabis Co. is stocked at 475 licensed dispensaries across Michigan, Massachusetts, and 2 other states, 359 of them in Michigan, with the deepest coverage in New Buffalo, Detroit, Grand Rapids, Monroe, and Ann Arbor. Search by ZIP code or city below to find the closest one, or filter by product type if you are after a specific format.
Market Insights Snapshot
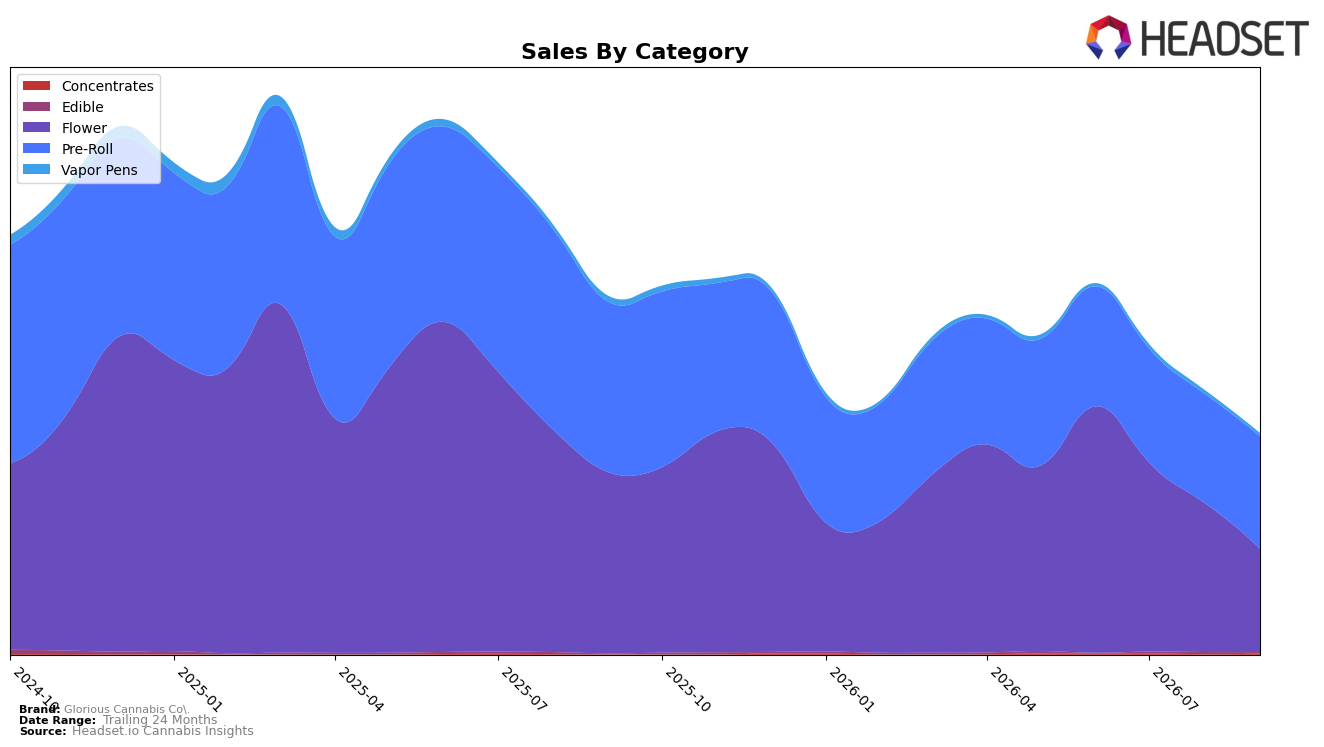
Glorious Cannabis Co. concentrated over half of September 2026 sales in Pre-Roll at 50.95% share with a 3.03% month-over-month uptick, despite a 34.07% year-over-year decline, while Flower held 46.79% share but fell 30.72% MoM and 43.02% YoY; the combined effect pushed the portfolio toward lower-priced units as Pre-Roll’s average price sat at $5.08 versus Flower at $26.17. Vapor Pens slipped to 1.27% share with a 20.97% MoM decline and a 50.49% YoY drop, whereas Edible, though only 0.56% share, posted 61.11% YoY growth but fell 32.60% MoM, and Concentrates surged 233.37% MoM and 1,294.78% YoY to 0.43% share; given the 4.98% YoY rise in average price and the brand’s -38.40% YoY sales change, the mix now relies on Pre-Roll stability and episodic spikes in small niches, implying revenue volatility concentrated in value-forward formats.
With Pre-Roll ranked 11 in Michigan and its share expanding versus Flower on a MoM basis by 3.03% versus -30.72%, the brand’s demand is tilting toward convenience and price-accessible SKUs, a position that can defend shelf space but caps premium trade-up. The 233.37% MoM surge in Concentrates alongside a 32.60% MoM pullback in Edible signals trial-driven, promotion-sensitive pockets that are too small to offset a 43.02% YoY Flower contraction; this pattern implies Glorious Cannabis Co. is migrating from a dual-format strategy toward a Pre-Roll-led identity with opportunistic, high-variance side bets, which supports velocity but risks margin compression as average price gains (+4.98% YoY) are not translating into total sales growth (-38.40% YoY).
Competitive Landscape
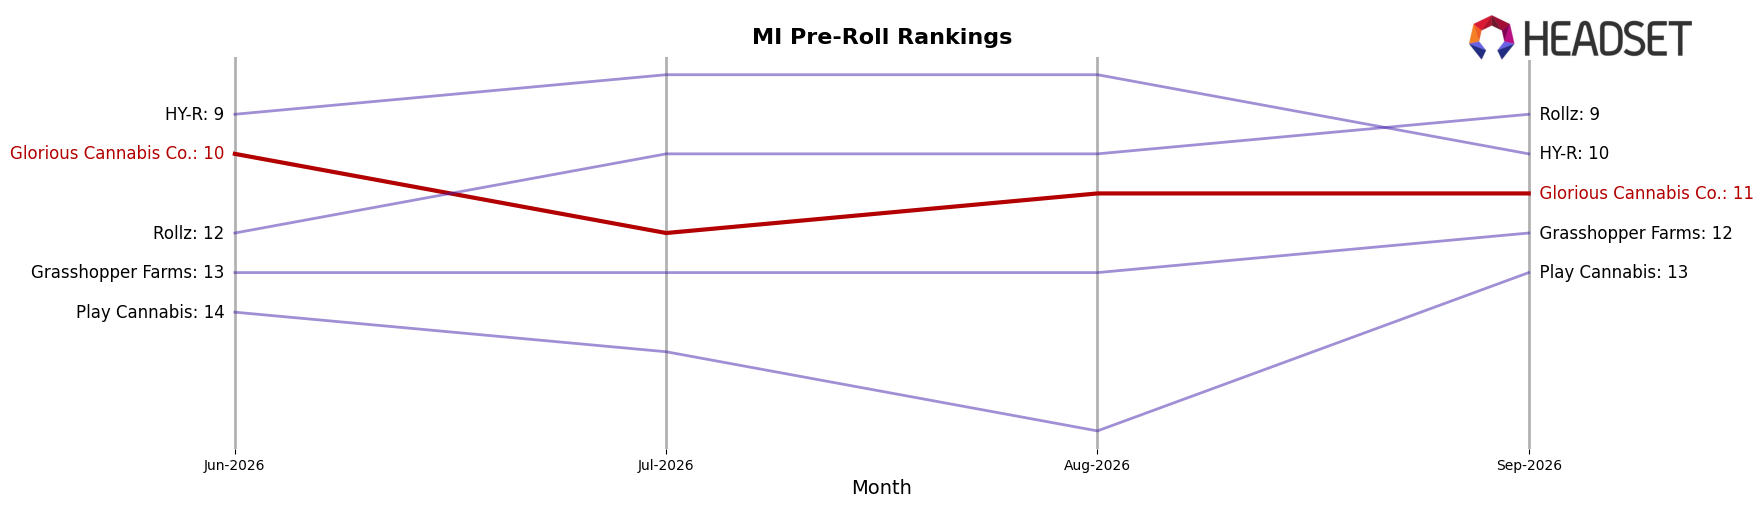
Glorious Cannabis Co. sits at rank #11 in MI Pre-Roll in September 2026, down 5 positions from #6 in September 2025, and 1 position lower than #10 in June 2026; this slide contrasts with Jeeter holding #1 year over year while growing sales by 149.9%, and diverges from Cali-Blaze staying at #2 despite a 36.1% YoY sales decline. With a prior peak at #5 in August 2025 and a current gap of 6 ranks from that peak, the pattern indicates Glorious Cannabis Co. is losing relative velocity against both surging incumbents at the top and stable rankers above it, implying a need to arrest rank erosion to re-enter the top 10.
Notable Products
Glorious Cannabis Co.'s Fire Styxx - Royal Punch Infused Pre-Roll (1g) posted the steepest movement in September 2026 with a -15.6% month-over-month decline, sliding to rank 6 while Fire Styxx - Grape Escape Infused Pre-Roll (1g) fell 14.2% at rank 9. In contrast, Fire Styxx - Glitter Apples Infused Pre-Roll (1g) rose 37.5% to rank 1, and Fire Styxx - Shipwrecked Infused Pre-Roll (1g) climbed 28.5% to rank 3, indicating demand consolidation at the very top. Eight of the top ten SKUs are Pre-Roll variants under the Fire Styxx family, with Fire Styxx - Blazing Star THCA Infused Pre-Roll (1g) nearly flat at -1.4% in rank 2 and Fire Styxx - Midnight Berry Infused Pre-Roll (1g) up 13.3% at rank 7, which concentrates revenue around a few high-velocity flavor lines even as weaker flavors retrench. The mix implies Glorious Cannabis Co. is leaning into a winner-take-most Pre-Roll portfolio, where outsized gains in a small number of leaders can offset mid-pack erosion and steer assortment pruning despite total category reliance on a single family.
Top Selling Cannabis Brands






Data for this report comes from real-time sales reporting by participating cannabis retailers via their point-of-sale systems, which are linked up with Headset’s business intelligence software. Headset’s data is very reliable, as it comes digitally direct from our partner retailers. However, the potential does exist for misreporting in the instance of duplicates, incorrectly classified products, inaccurate entry of products into point-of-sale systems, or even simple human error at the point of purchase. Thus, there is a slight margin of error to consider. Brands listed on this page are ranked in the top twenty within the market and product category by total retail sales volume.

