Jun-2026
Sales
Trend
6-Month
Product Count
SKUs
Avg Price
YoY Sales Change
YoY Price Change
Market Insights Snapshot
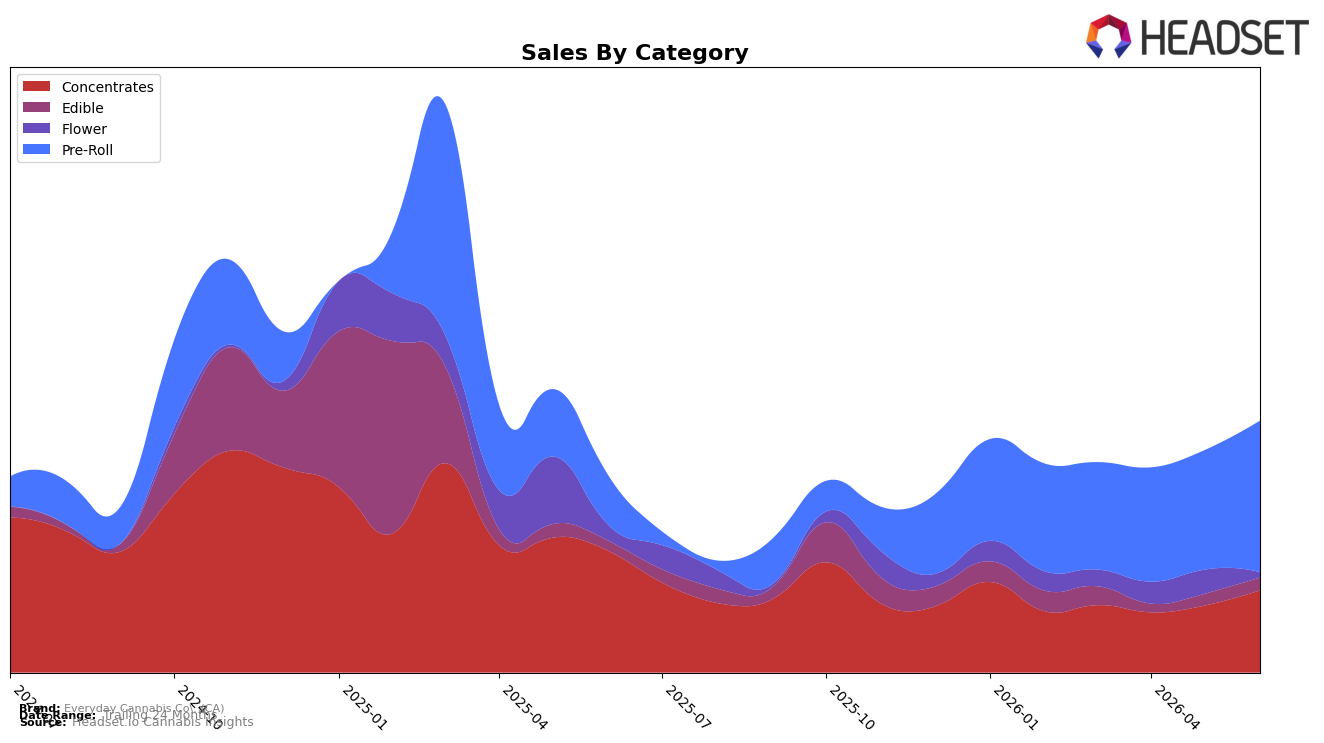
Everyday Cannabis Co. (CA) concentrated its June 2026 mix around Pre-Roll at 60.25% share and rank 59 in California Pre-Roll, with category sales up 206.18% year over year and 26.77% month over month, while brand-level sales rose 27.73% YoY and average price fell 17.61% YoY. Concentrates held 32.69% share with a 22.86% MoM lift but a 32.46% YoY decline, and Flower contracted to 2.12% share with a 65.95% YoY drop and 77.82% MoM pullback; Edible, at 4.94% share, grew 23.71% YoY and 7.34% MoM. The pattern implies deliberate pivoting into value-leaning Pre-Roll (avg price $8.36) while de-emphasizing Flower, using lower prices to expand volume and defend rank in a large category.
With Pre-Roll now over 60% of mix and Concentrates still nearly one-third, the brand is prioritizing high-velocity, lower-ticket formats to drive unit throughput, as evidenced by a 26.77% MoM Pre-Roll surge alongside a 22.86% MoM gain in Concentrates. The simultaneous 77.82% MoM contraction in Flower and 32.46% YoY decline in Concentrates indicates pruning of underperforming or margin-strained lines, while maintaining breadth through Edible’s 23.71% YoY growth and 4.94% share. This positioning implies Everyday Cannabis Co. (CA) is optimizing for scalable share capture in Pre-Roll at rank 59 and stabilizing the portfolio around price-sensitive segments to sustain the 27.73% YoY brand sales growth despite a 12.77% decline over 24 months.
Competitive Landscape
Everyday Cannabis Co. (CA) sits at rank #59 in CA Pre-Roll in June 2026, a 61-place improvement from #120 year over year, and a 27-spot climb from #86 three months ago; relative to its historical ceiling of #38 set in March 2025, the brand remains 21 positions lower, indicating partial recovery rather than a full return to peak. Meanwhile, Jeeter held steady at #1 year over year while growing sales by 66.1%, and STIIIZY remained at #2 with a 382.3% sales increase, suggesting that top-tier velocity is consolidating even as Everyday Cannabis Co. (CA) gains rank share from the mid-pack; this trajectory implies the brand is successfully re-entering the consideration set but must convert recent rank momentum into sustained share capture to bridge the 21-rank gap back to its March 2025 peak.

Notable Products
Everyday Slugger - Royal Haze Infused Pre-Roll (1.5g) posted the largest month-over-month move at +90.2% while holding a top-three position at rank 3, signaling outsized velocity at the premium infused end. The June 2026 leaderboard is dominated by Pre-Rolls, with six of the top ten SKUs in the format and ranks clustered at 1, 2, 3, 4, 5, and 8, whereas Concentrates occupy ranks 7, 9, and 10 with no >10% swings reported. Everyday Slugger - Lemon Cherry Gelato Live Resin Infused Pre-Roll (1.5g) led the chart at rank 1 and Everyday Slugger - Blue Sherbert Infused Pre-Roll (1.5g) followed at rank 2, together indicating the infused Slugger platform is concentrating share at the very top despite mixed absolute sales levels around $14,726 for the fastest riser. The pattern implies portfolio momentum is consolidating around infused Pre-Rolls, with Concentrates serving as secondary volume anchors rather than primary growth drivers.
Top Selling Cannabis Brands
Data for this report comes from real-time sales reporting by participating cannabis retailers via their point-of-sale systems, which are linked up with Headset’s business intelligence software. Headset’s data is very reliable, as it comes digitally direct from our partner retailers. However, the potential does exist for misreporting in the instance of duplicates, incorrectly classified products, inaccurate entry of products into point-of-sale systems, or even simple human error at the point of purchase. Thus, there is a slight margin of error to consider. Brands listed on this page are ranked in the top twenty within the market and product category by total retail sales volume.

