.svg)

Sep-2026
Sales
Trend
6-Month
Product Count
SKUs
Avg Price
YoY Sales Change
YoY Price Change


Where to Buy
Pistil Whip is stocked at 192 licensed dispensaries across California, with the deepest coverage in Los Angeles, Santa Ana, San Diego, Long Beach, and Sacramento. Search by ZIP code or city below to find the closest one, or filter by product type if you are after a specific format.
Market Insights Snapshot
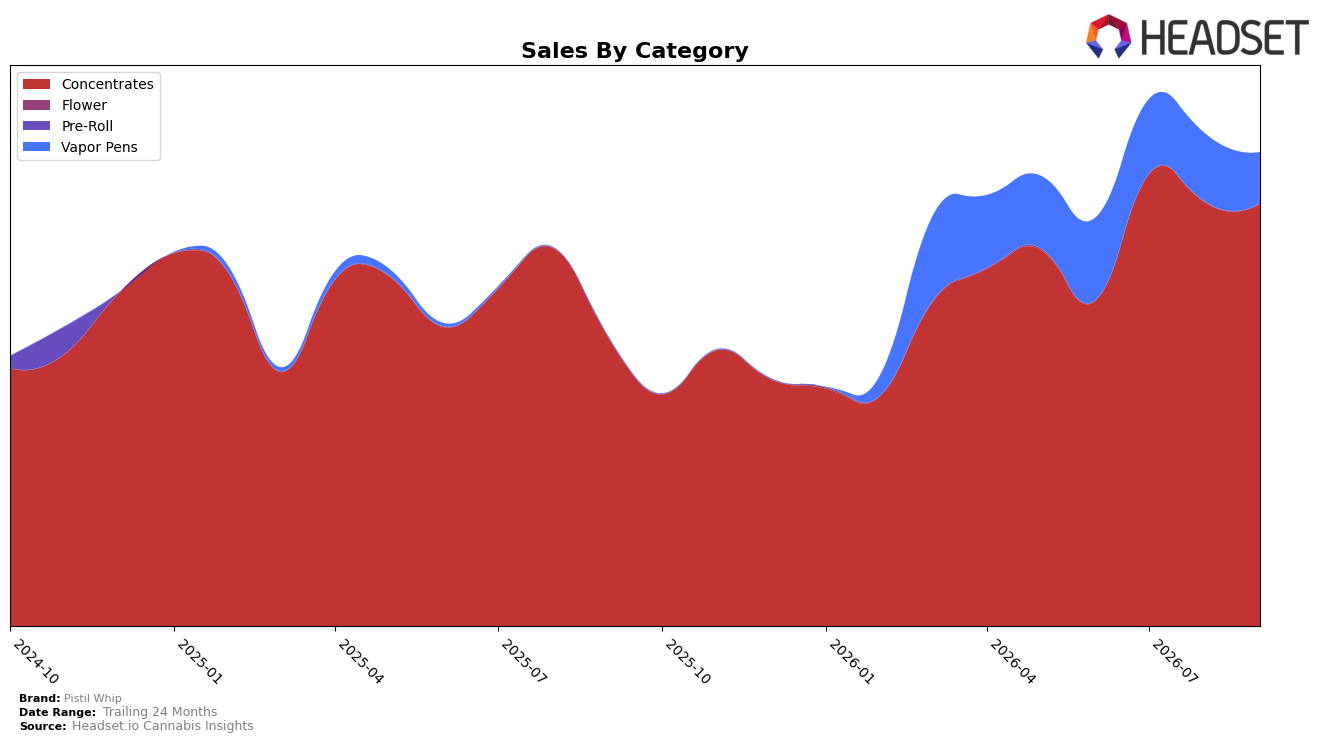
In September 2026, Pistil Whip’s mix concentrated heavily in Concentrates at 89.31% share (ranked 16th in California Concentrates), with Vapor Pens at 10.69% share; the category split pairs a 46.34% YoY gain in Concentrates with an 8,748.31% YoY surge in Vapor Pens, while MoM shifted down 0.40% for Concentrates and down 25.57% for Vapor Pens. Against a 63.54% brand-level YoY sales increase and a 24.63% YoY drop in average price to $25.05, the data indicates the brand is anchoring volume in Concentrates while using lower price points to accelerate trial in Vapor Pens, implying that September 2026 growth leaned on breadth within the core rather than sustained monthly momentum in the nascent pen line.
The 89.31% Concentrates share alongside a 16th-place ranking and only a 0.40% MoM dip suggests entrenched shelf presence, whereas the 10.69% Vapor Pens share with a 25.57% MoM decline indicates volatility inconsistent with repeat-driven penetration; together with an 8,748.31% YoY spike in pens and a 46.34% YoY lift in Concentrates, the mix signals trial-heavy expansion at the edge and franchise stability at the core. This pattern implies Pistil Whip’s positioning is skewing toward a Concentrates-first identity that can be leveraged to ladder consumers into Vapor Pens, but the MoM softness in pens points to a need for retention mechanics and tighter price-pack architecture if the brand is to convert the outsized YoY influx into durable share carryover within September 2026 and beyond.
Competitive Landscape
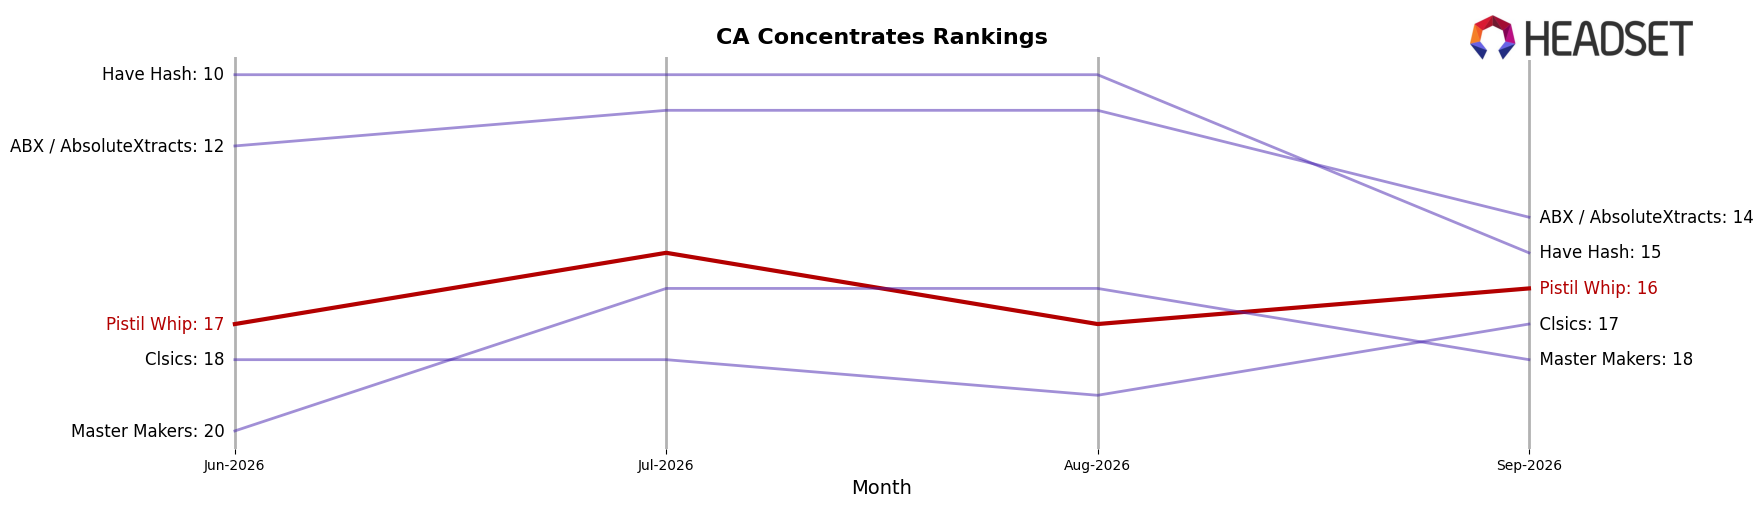
Pistil Whip sits at rank #16 in September 2026, a 4-position YoY improvement from #20, and a 1-position gain from #17 in June 2026; however, it remains 3 spots below its peak of #13 from January 2025, indicating partial recovery rather than full re-attainment. Against competitors, Raw Garden held #1 both YoY and currently while growing sales by 9.37%, and 710 Labs climbed from #4 to #2 with 32.70% YoY sales growth, outpacing Pistil Whip’s rank momentum; meanwhile, Punch Extracts / Punch Edibles slipped from #3 to #4 alongside a -7.68% YoY sales change, suggesting room for Pistil Whip to capture share if upward movement continues. The pattern implies that Pistil Whip’s steady rank gains are enough to narrow distance to mid-tier leaders but not yet to dislodge fast-rising players, so sustaining sequential improvements is the path to re-entering the low-teens bracket and testing #13 again.
Notable Products
Garlic Juice Live Rosin Badder (1g) posted the standout move in September 2026 with a +197.9% month-over-month jump to rank 3, while Maui Mimosa Live Rosin Badder (1g) fell -45.2% to a tied rank of 8, marking the steepest decline among the listed top SKUs. Guava Diesel Live Rosin Badder (1g) held rank 1 as the category anchor, and Strawnana Split Live Rosin Badder (1g) sat at rank 2, indicating a tight top tier despite volatility deeper in the list. Nine of the top ten are Concentrates live rosin badders, concentrating demand in a single format and implying Pistil Whip is leaning into a depth strategy around live rosin SKUs rather than broadening into adjacent categories.
Top Selling Cannabis Brands






Data for this report comes from real-time sales reporting by participating cannabis retailers via their point-of-sale systems, which are linked up with Headset’s business intelligence software. Headset’s data is very reliable, as it comes digitally direct from our partner retailers. However, the potential does exist for misreporting in the instance of duplicates, incorrectly classified products, inaccurate entry of products into point-of-sale systems, or even simple human error at the point of purchase. Thus, there is a slight margin of error to consider. Brands listed on this page are ranked in the top twenty within the market and product category by total retail sales volume.

