Market Insights Snapshot
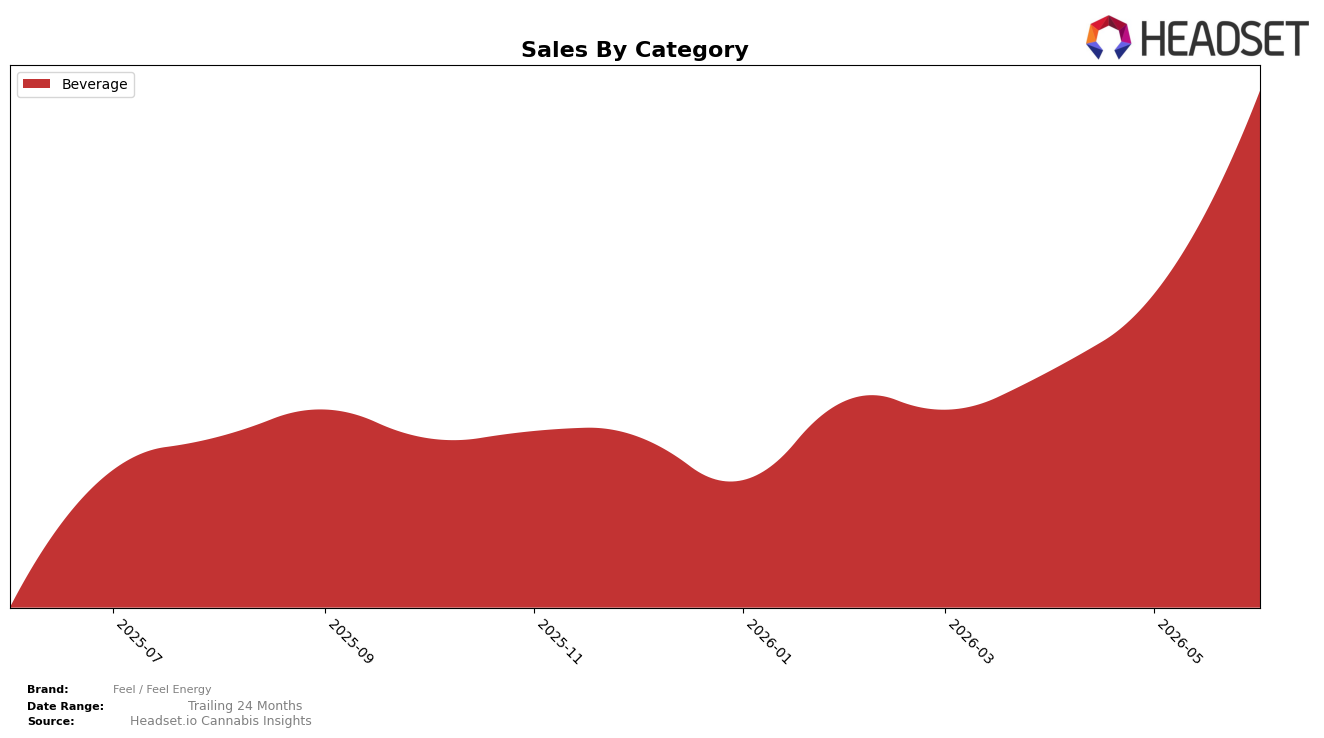
In June 2026, Feel / Feel Energy operated as a single-category brand with Beverage at 100.0% of sales, posting 928.98% year-over-year growth and 55.22% month-over-month growth, while average price rose 21.05% year over year to $5.69. With Beverage concentration at 100.0% and a state-category rank of 10 in Michigan Beverage, the pattern implies that expansion is driven by depth within one format rather than portfolio spread, and the elevated price mix alongside rapid unit or velocity gains points to momentum that is sensitive to pricing headroom and in-aisle visibility.
The combination of a 55.22% month-over-month surge on top of 928.98% year-over-year growth, alongside a 21.05% price lift, indicates that recent share capture is more volume-led than purely price-driven and that the brand’s positioning is indexing toward value-per-serving rather than discount appeal. Holding the 10th rank in Michigan Beverage while remaining 100.0% concentrated in Beverage suggests the brand is competing on velocity within its lane; this concentration increases exposure to category cyclicality but also signals a clear positioning thesis where further gains likely hinge on sustaining repeat in Beverage rather than diversifying into adjacent categories.
Competitive Landscape
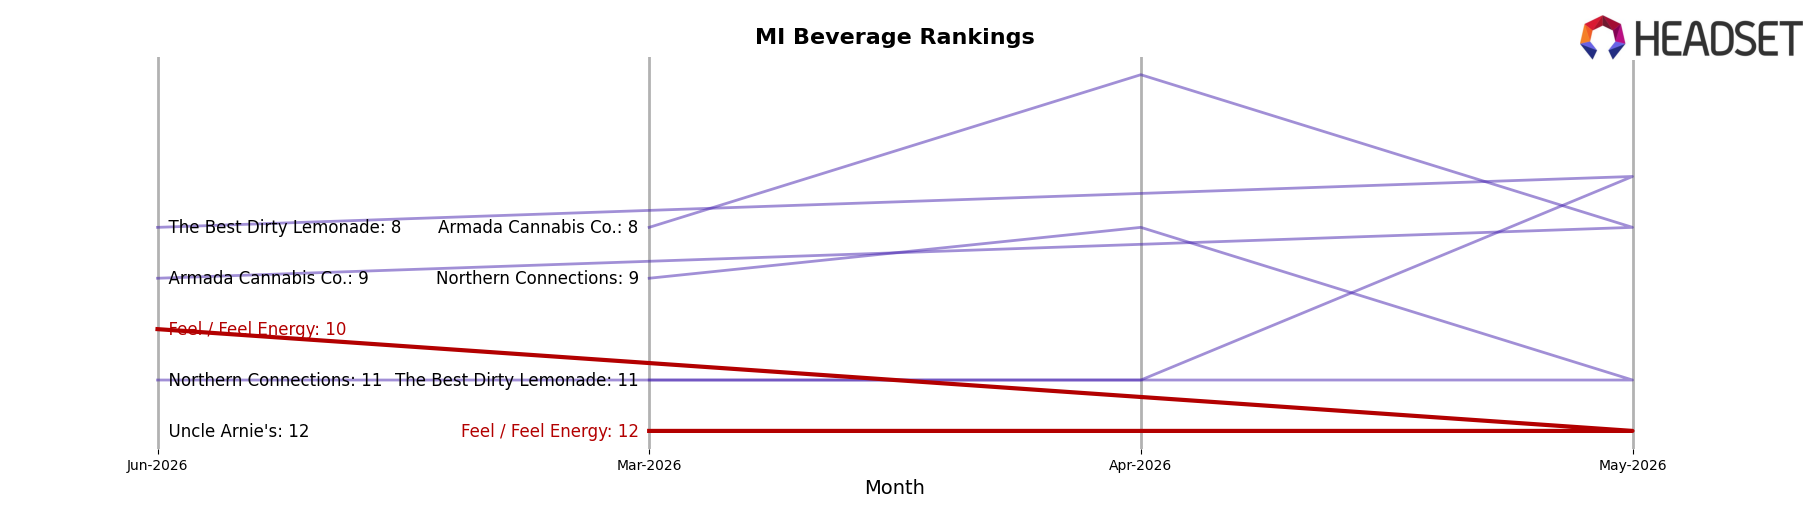
Feel / Feel Energy sits at #10 in MI Beverage in June 2026, improving 6 ranks from #16 year over year and 2 ranks from #12 since March 2026, with June 2026 also marking its peak rank of #10; meanwhile, Mary Jones advanced from #2 to #1 on 22.2% YoY sales growth while Keef Cola slid from #1 to #2 amid a 10.5% YoY sales decline, indicating that Feel / Feel Energy’s upward rank movement is occurring alongside leadership reshuffling at the top and suggests a pathway to further share gains if momentum sustains against both accelerating risers and weakening incumbents.
Notable Products
Wildberry Pomegranate Seltzer (10mg THC, 12oz, 355ml) set the tone in June 2026 with a 143.99% month-over-month surge and a jump to rank 1, signaling a sharp pivot toward a single flagship flavor. Dragonfruit Lime Seltzer (10mg THC, 12oz, 355ml) held rank 2 with a 30.61% increase while Mango Passionfruit Seltzer (10mg THC, 12oz, 355ml) maintained rank 3 on a 17.45% rise, and together these placements indicate three of the top four SKUs are Beverage variants from the same seltzer family. THC/Caffeine 1:3 Mango Passionfruit (10mg THC, 12oz, 355ml) advanced at 13.76% into rank 4, and the top SKU alone reached $28,298, concentrating volume at the very top of the lineup. The pattern implies Feel / Feel Energy is consolidating demand around flavor-led Beverage seltzers, using a breakout hero SKU to anchor share while adjacent variants provide depth rather than dispersion.
Top Selling Cannabis Brands
Data for this report comes from real-time sales reporting by participating cannabis retailers via their point-of-sale systems, which are linked up with Headset’s business intelligence software. Headset’s data is very reliable, as it comes digitally direct from our partner retailers. However, the potential does exist for misreporting in the instance of duplicates, incorrectly classified products, inaccurate entry of products into point-of-sale systems, or even simple human error at the point of purchase. Thus, there is a slight margin of error to consider. Brands listed on this page are ranked in the top twenty within the market and product category by total retail sales volume.

