Jun-2026
Sales
Trend
6-Month
Product Count
SKUs
Avg Price
YoY Sales Change
YoY Price Change
Market Insights Snapshot
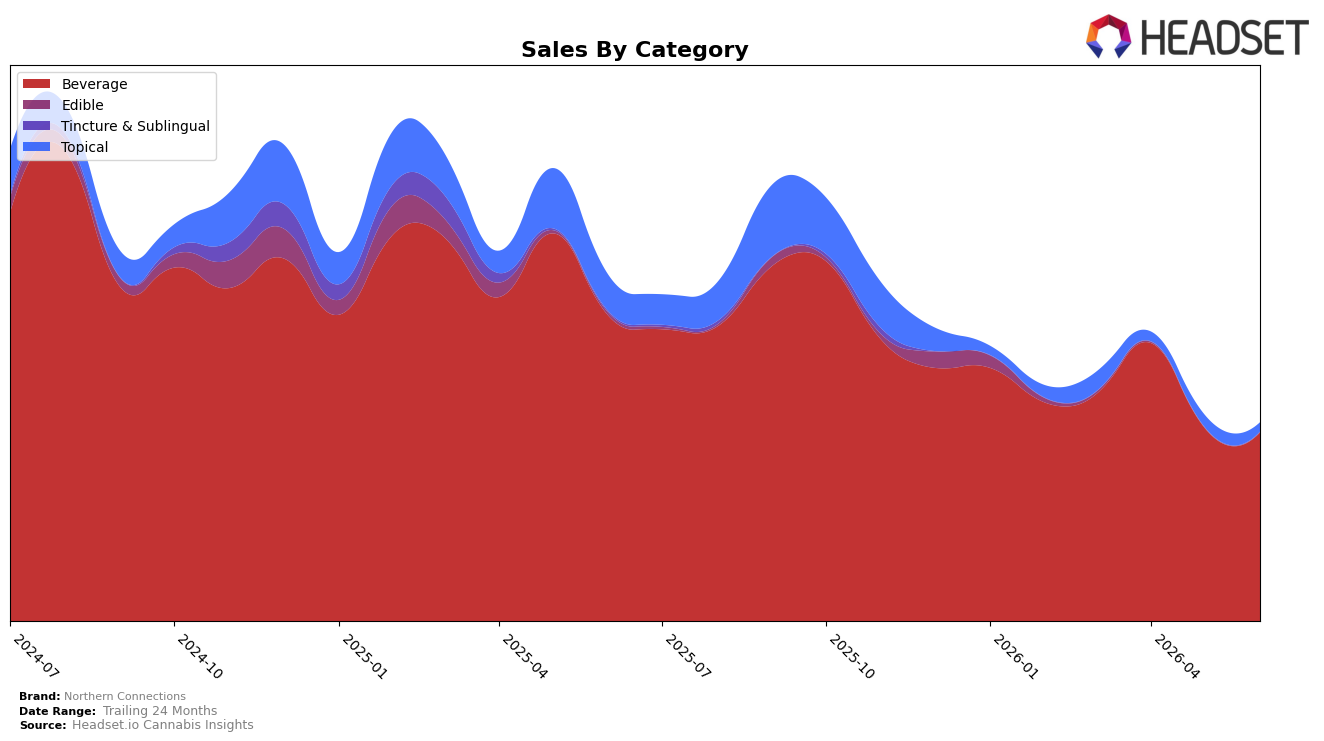
Beverage accounted for 95.50% share in June 2026 with a year-over-year decline of 38.29% and a month-over-month dip of 2.34%, while Topical held 4.50% share with a steeper year-over-year drop of 75.30% and a month-over-month decline of 25.58%. Average price rose 9.16% year over year to $11.18 as Beverage priced at $10.91 contrasts with Topical at $23.52, implying a mix shift toward lower-priced volume even as overall brand sales fell 42.80% year over year. The pattern implies Northern Connections is increasingly concentrated in Beverage and absorbing price-led value preservation rather than volume expansion, with Topical erosion accelerating share consolidation.
With Beverage dominance at 95.50% and a rank of 11 in Michigan Beverage, the brand sits in a middle-tier position where small share losses can push rank downward as Topical weakens by 25.58% month over month. The 2.34% month-over-month decline in Beverage paired with a 9.16% year-over-year price increase suggests reliance on pricing to offset shrinking units, which risks further elasticity pressure in price-sensitive drink formats. The pattern implies near-term positioning hinges on stabilizing Beverage velocities rather than pursuing breadth, because Topical’s 4.50% share and 75.30% year-over-year decline offer limited headroom to influence overall rank.
Competitive Landscape
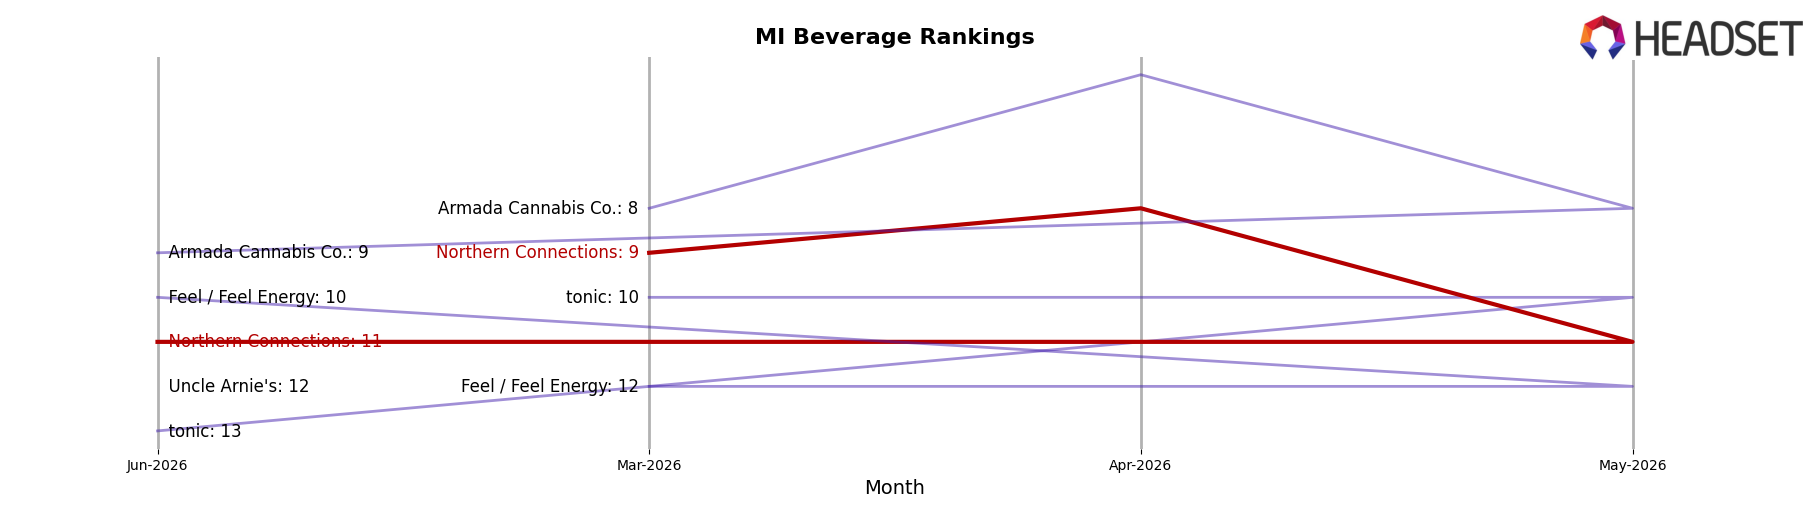
Northern Connections sits at #11 in MI Beverage in June 2026, sliding 6 positions year over year from #5 and down 2 positions versus March 2026’s #9, while its historical ceiling remains #3 from February 2025; in contrast, Mary Jones climbed from #2 to #1 with 22.2% sales growth and Keef Cola dipped from #1 to #2 amid a 10.5% sales decline, indicating that Northern Connections’ two-quarter drift and 6-rank YoY drop signal share being absorbed upward by faster-advancing leaders and suggest the brand is ceding rank momentum to competitors with accelerating growth.
Notable Products
Liquid Loud- Sharkleberry Syrup (200mg) posted the largest month-over-month movement with a 124.6% jump, rising into rank 3, while Naked Liquid Loud Syrup (200mg) climbed 84.2% to rank 1. Mixed Berry Rosin Infused Mix Stix 4-Pack (200mg) fell 17.1% while holding rank 5, and Northern Connections X Ice Kream Hash Co- Peach Mango Liquid Loud Syrup (200mg) slipped 3.3% at a shared rank 4. With syrups occupying three of the top four ranks and at least four of the top ten belonging to the Liquid Loud syrup family, the mix points to a pivot toward syrup-led velocity and away from Mix Stix reliance despite one Mix Stix SKU still retaining a top-five slot.
Top Selling Cannabis Brands
Data for this report comes from real-time sales reporting by participating cannabis retailers via their point-of-sale systems, which are linked up with Headset’s business intelligence software. Headset’s data is very reliable, as it comes digitally direct from our partner retailers. However, the potential does exist for misreporting in the instance of duplicates, incorrectly classified products, inaccurate entry of products into point-of-sale systems, or even simple human error at the point of purchase. Thus, there is a slight margin of error to consider. Brands listed on this page are ranked in the top twenty within the market and product category by total retail sales volume.

