.svg)

Sep-2026
Sales
Trend
6-Month
Product Count
SKUs
Avg Price
YoY Sales Change
YoY Price Change


Where to Buy
High Heads is stocked at 15 licensed dispensaries across Nevada, with the deepest coverage in Las Vegas, Henderson, North Las Vegas, Fernley, and Mesquite. Search by ZIP code or city below to find the closest one, or filter by product type if you are after a specific format.
Market Insights Snapshot
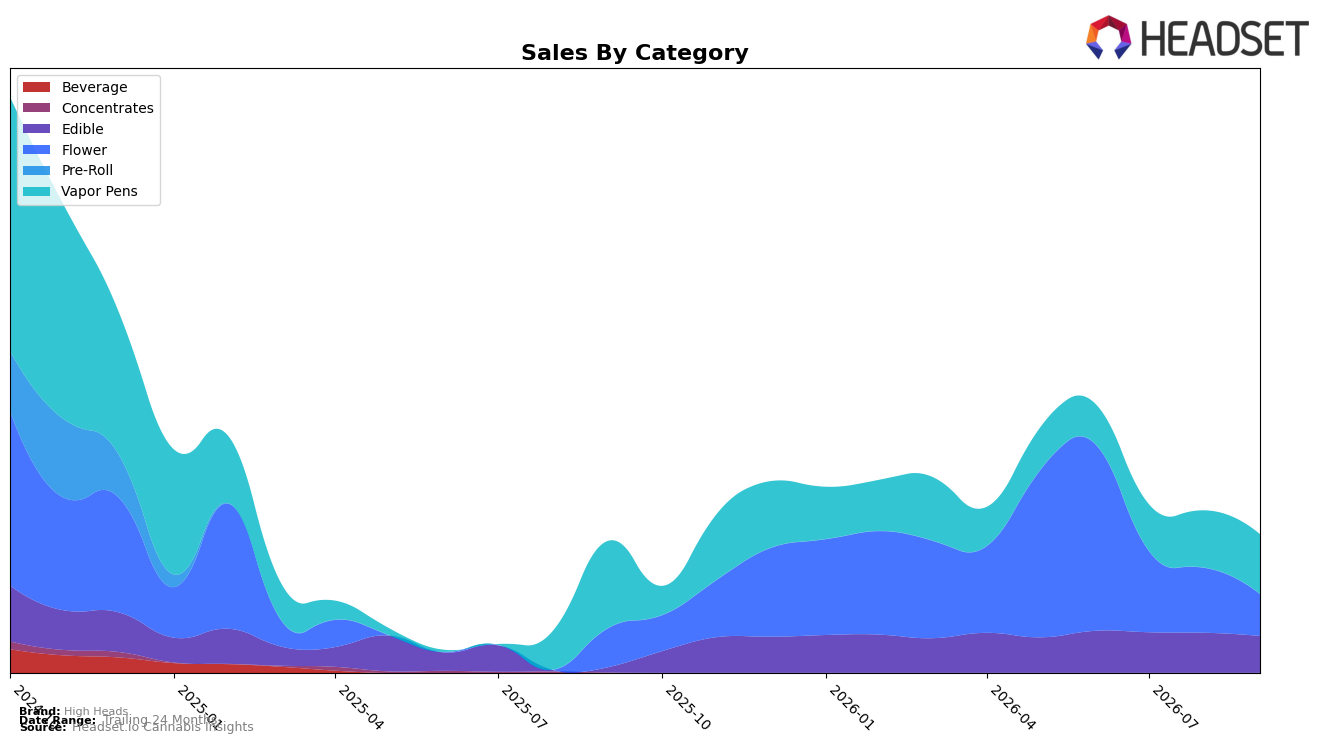
In September 2026, High Heads shifted toward a three-way split anchored by Vapor Pens at 43.15% share (ranked 22 in Vapor Pens in Nevada), with a 4.07% month-over-month uptick but a 31.67% year-over-year decline, while Flower held 30.24% share with a 7.48% year-over-year gain but a steep 35.53% month-over-month drop. Edible expanded to 26.60% share on a 624.38% year-over-year surge despite an 8.03% month-over-month pullback, coinciding with a 24.27% year-over-year cut to the brand’s average price and a 5.03% year-over-year lift in total sales; taken together, the mix shows a pivot toward lower-priced formats and a stabilization bet on Vapor Pens despite category rank pressure at 22.
The mix reweighting implies High Heads is trading depth in premium-priced Flower (average price $33.67) for volume capture in Edible (average price $8.41) and steadying share in Vapor Pens (average price $19.87), aligning with the brand’s 24.27% price decrease and a 5.03% sales increase year over year. With Flower’s sharp 35.53% month-over-month contraction versus Vapor Pens’ 4.07% month-over-month gain and Edible’s 8.03% month-over-month dip, the portfolio is leaning into repeatable, mid-ticket penetration rather than high-ticket spikes, which positions the brand to prioritize rank recovery in Vapor Pens at 22 while using Edible’s 624.38% year-over-year expansion as a demand hedge.
Competitive Landscape
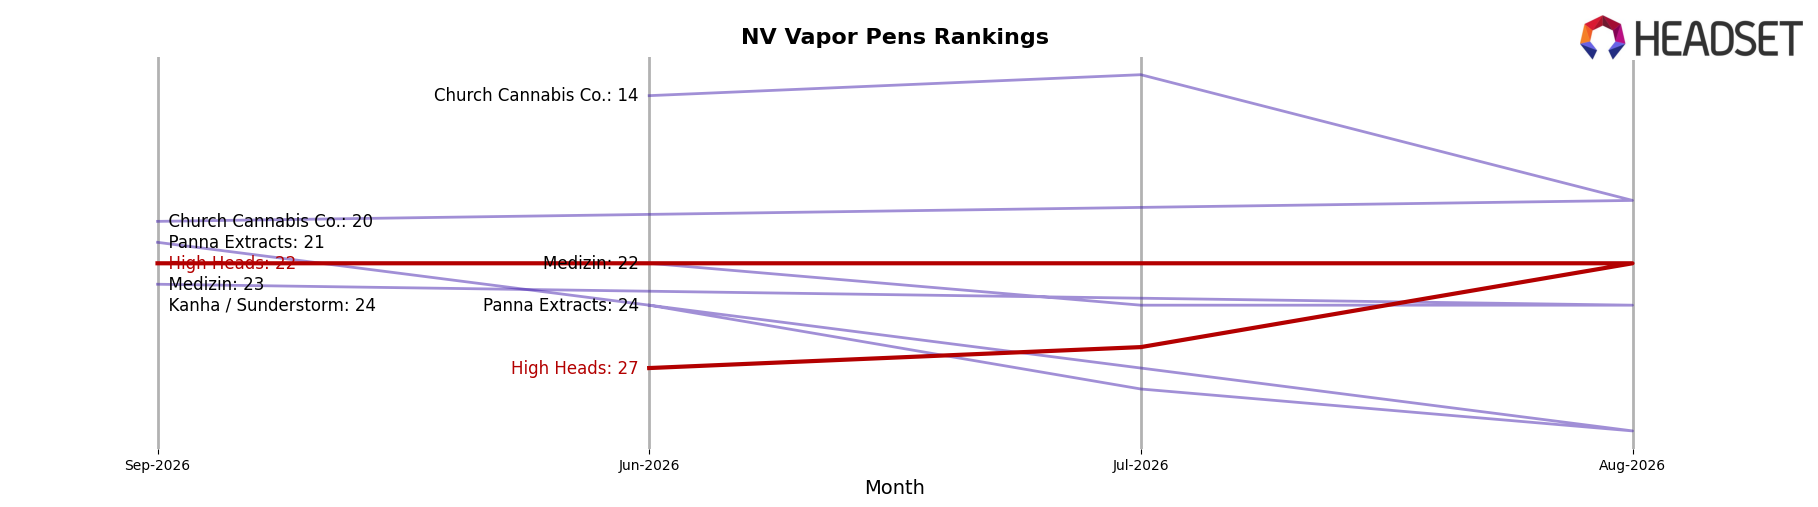
High Heads ranks #22 in NV Vapor Pens in September 2026, down 5 spots from #17 year over year and up 5 spots from #27 since June 2026; against a market where Rove held #1 both this month and year over year while its sales fell 30.8%, and Dime Industries climbed from #23 to #3 with 541.8% YoY growth. Despite a historical peak at #7 in November 2024, the brand’s current #22 alongside STIIIZY steady at #2 with a 47.4% YoY decline signals that High Heads’ trajectory is drifting toward the lower-middle tier, implying that reclaiming share will require reversing the YoY rank erosion rather than relying on broader category softness.
Notable Products
CBD/THC 1:1 Sour Cherry Blast Gummies 10-Pack (100mg CBD, 100mg THC) posted the steepest decline in September 2026 at -18.2% and sits at rank 3, while Razzle Dazzle Gummies 10-Pack (100mg) fell -14.4% to rank 2; in contrast, CBG/CBC/THC 1:1:1 Sour Wonder Melon Gummies 10-Pack (100mg CBG, 100mg CBC, 100mg THC) in rank 1 inched up 5.8% with approximately $19,214 in sales. Vapor pen momentum contrasted the Edible softness, as Slurricane Distillate Cartridge (1g) rose 21.2% to rank 8 and Gelonade Distillate Cartridge (0.9g) added 6.7% at rank 7, while two additional Vapor Pens occupied ranks 9 and 10. With six of the top ten as Edible SKUs but the only double-digit MoM gain coming from a Vapor Pen, the mix signals a pivot in shopper interest toward inhalables within the top tier. The pattern implies High Heads is relying on a single lead Edible to anchor volume while diversification and faster velocity sit in Vapor Pens, suggesting near-term merchandising should lean into cartridge breadth while stabilizing mixed-cannabinoid gummies.
Top Selling Cannabis Brands






Data for this report comes from real-time sales reporting by participating cannabis retailers via their point-of-sale systems, which are linked up with Headset’s business intelligence software. Headset’s data is very reliable, as it comes digitally direct from our partner retailers. However, the potential does exist for misreporting in the instance of duplicates, incorrectly classified products, inaccurate entry of products into point-of-sale systems, or even simple human error at the point of purchase. Thus, there is a slight margin of error to consider. Brands listed on this page are ranked in the top twenty within the market and product category by total retail sales volume.

