Jun-2026
Sales
Trend
6-Month
Product Count
SKUs
Avg Price
YoY Sales Change
YoY Price Change
Market Insights Snapshot
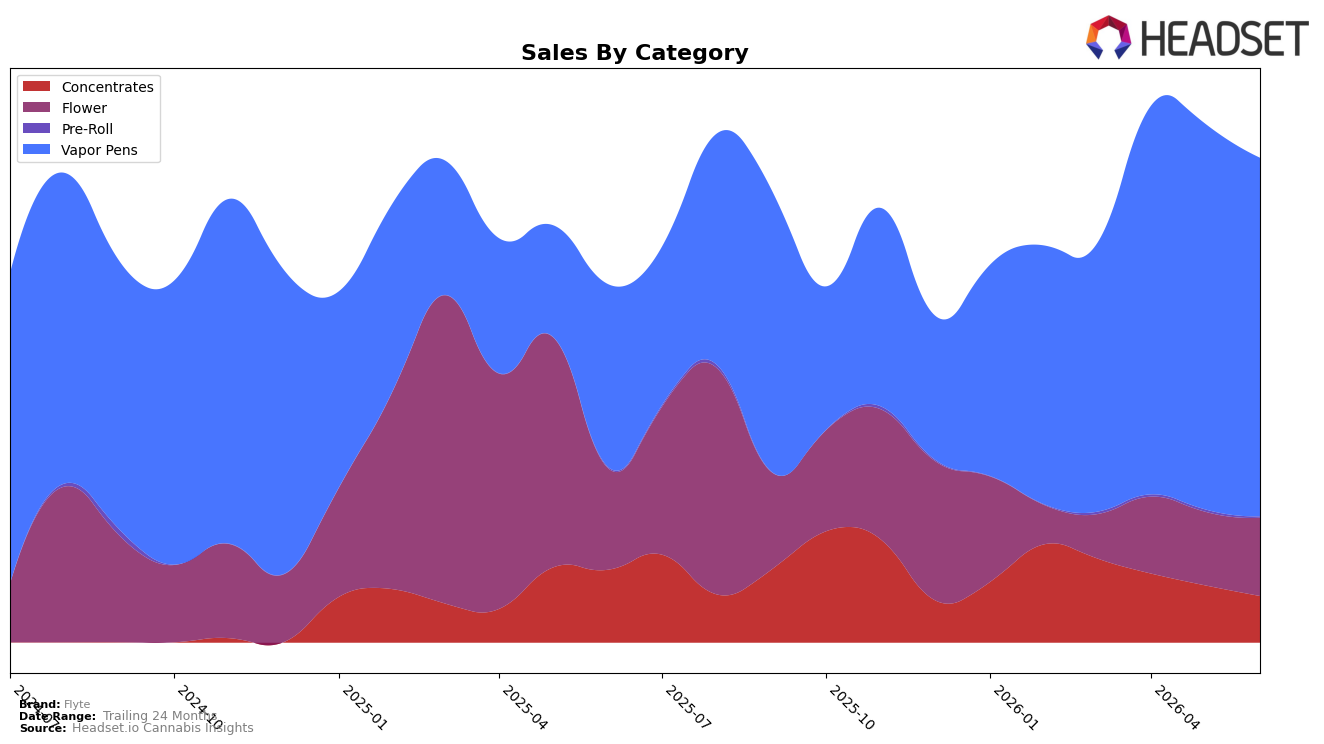
In June 2026, Flyte’s mix concentrated further in Vapor Pens at 74.09% share, with the segment up 96.24% year over year but down 7.12% month over month, while Flower held 16.11% share with sales down 22.87% YoY yet up 6.26% MoM. Concentrates accounted for 9.59% share with a 36.20% YoY decline and an 18.80% MoM drop, and Pre-Roll remained marginal at 0.21% share with 20.32% YoY growth but a 48.03% MoM step-back. With brand sales up 35.42% YoY alongside a 9.41% YoY decrease in average price, the pattern implies Flyte is leaning into Vapor Pens volume to offset weakness in Concentrates and Flower, using price to expand reach while tolerating near-term MoM volatility in the core segment.
These shifts reposition Flyte as a Vapor Pens-first brand, where a 74.09% category share and a 96.24% YoY surge indicate scale advantages even as the category’s 7.12% MoM decline exposes sensitivity to short-cycle demand or promo cadence. The simultaneous 22.87% YoY contraction in Flower and 36.20% YoY contraction in Concentrates, coupled with a 9.41% YoY price reduction and a higher $48.34 average price in Concentrates versus $32.01 in Vapor Pens, suggest Flyte is prioritizing accessible price points to widen penetration while deemphasizing premium, smaller-basket formats. The implication is a portfolio tuned for velocity in Vapor Pens, where sustaining June 2026 gains will depend on stabilizing MoM softness while using incremental Flower MoM growth of 6.26% to diversify mix without diluting the Vapor Pens-led identity.
Competitive Landscape
Flyte sits at rank #38 in BC Vapor Pens in June 2026, unchanged from #38 year over year, while improving 5 positions from #43 in March 2026; against a longer arc, it is 15 spots below its peak at #23 in August 2024. In contrast, BoxHot held #1 year over year to #1 in June 2026 despite a -7.1% sales change, and Spinach climbed from #4 to #2 with +129.9% YoY sales, indicating Flyte’s flat rank amid aggressive upward movement by leaders and mid-pack climbers points to share dilution risk unless mix or distribution shifts are made.

Notable Products
Smashin Passion Distillate Disposable (0.5g) posted the steepest slide at -47.7% month over month and fell to rank 5 in June 2026, while Yuzu Mandarin Liquid Diamonds Cartridge (1g) declined -22.0% at rank 2, signaling demand rotation away from certain disposables and citrus-forward SKUs. Bubble Mania Ice Liquid Diamonds Cartridge (1g) in contrast inched up +3.8% and held rank 1, and Melon Menage Liquid Diamonds Cartridge (1g) slipped -10.0% at rank 10, indicating that Liquid Diamonds remains anchored by one flagship while tail SKUs soften. Eight of the top ten are Vapor Pens, concentrating mix risk in a single category even as Watermelon Distillate Disposable (0.5g) rose +8.6% at rank 4 and Grape Limeade Freeze Distillate Cartridge (1.1g) was roughly flat at -0.8% at rank 7. The pattern implies Flyte is consolidating around a pen-led portfolio where a single leader and selective flavor profiles drive volume concentration, and June 2026 performance points to pruning underperforming disposables to stabilize share.
Top Selling Cannabis Brands
Data for this report comes from real-time sales reporting by participating cannabis retailers via their point-of-sale systems, which are linked up with Headset’s business intelligence software. Headset’s data is very reliable, as it comes digitally direct from our partner retailers. However, the potential does exist for misreporting in the instance of duplicates, incorrectly classified products, inaccurate entry of products into point-of-sale systems, or even simple human error at the point of purchase. Thus, there is a slight margin of error to consider. Brands listed on this page are ranked in the top twenty within the market and product category by total retail sales volume.

