.svg)

Sep-2026
Sales
Trend
6-Month
Product Count
SKUs
Avg Price
YoY Sales Change
YoY Price Change


Market Insights Snapshot
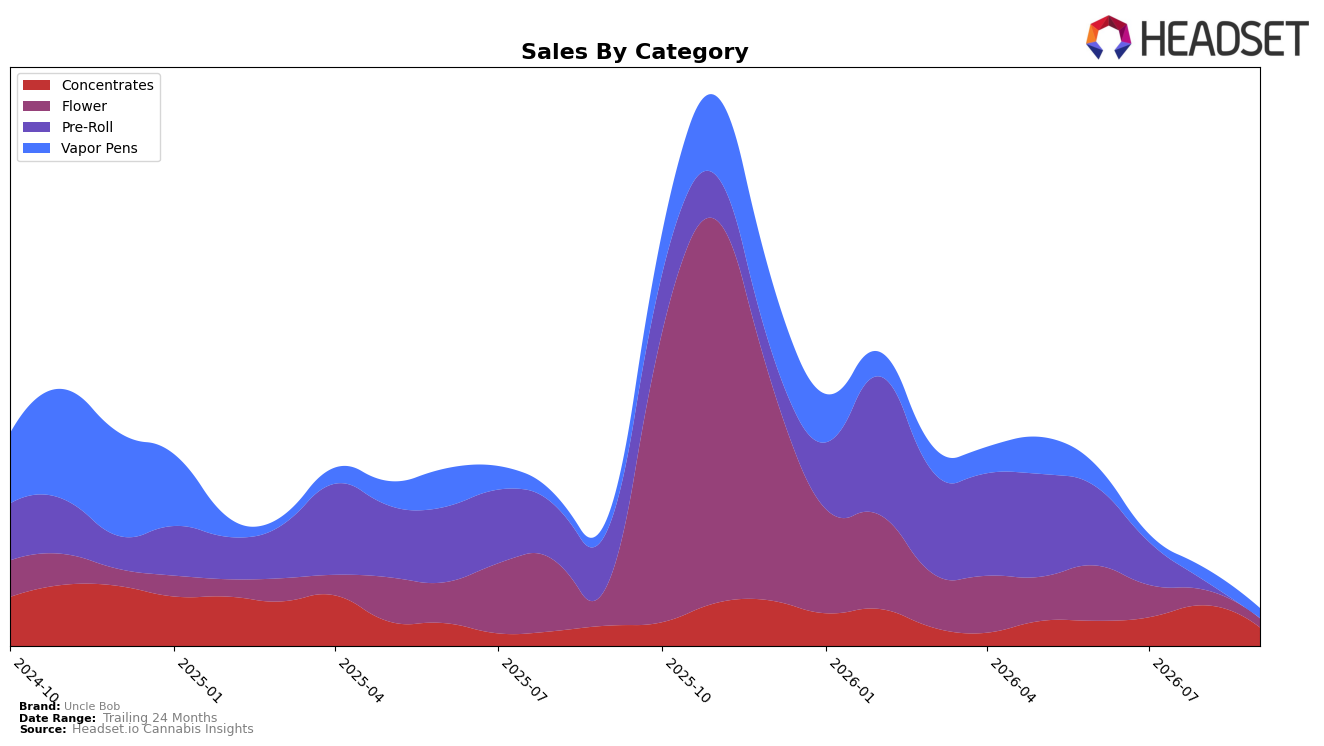
In September 2026, Uncle Bob’s category mix concentrated into three pillars: Concentrates at 48.34% share with year-over-year down 8.97% and month-over-month down 53.79%, Vapor Pens at 26.05% share with year-over-year down 21.26% and month-over-month down 22.20%, and Flower at 23.93% share with year-over-year down 78.04% and month-over-month down 40.21%; Pre-Roll shrank to 1.68% share with year-over-year down 98.79% and month-over-month down 92.92%. Against a brand-level year-over-year sales decline of 70.11% and an average price that rose 101.22%, this mix indicates a rapid pullback from low-price, high-volume formats while Concentrates, despite a 53.79% month-over-month contraction, now anchors nearly half of sales. The pattern implies the portfolio is being pruned toward higher ticket items (average price $29.26) while volume-sensitive segments are being exited or deprioritized at a faster pace than the overall brand decline.
Positioning-wise, anchoring at rank 30 in Concentrates in British Columbia alongside a 48.34% category share within the brand mix and a 22.20% month-over-month pullback in Vapor Pens suggests Uncle Bob is leaning into a niche where it still retains relative footing while stepping back from Flower, which fell 78.04% year-over-year and 40.21% month-over-month. With Pre-Roll effectively minimized to 1.68% share and Concentrates and Vapor Pens combining for 74.39% of sales, the implied strategy is to defend relevance in Concentrates despite the 53.79% month-over-month hit, using a tighter assortment and higher realized pricing to stabilize rank positioning rather than chase breadth across declining volume categories.
Competitive Landscape
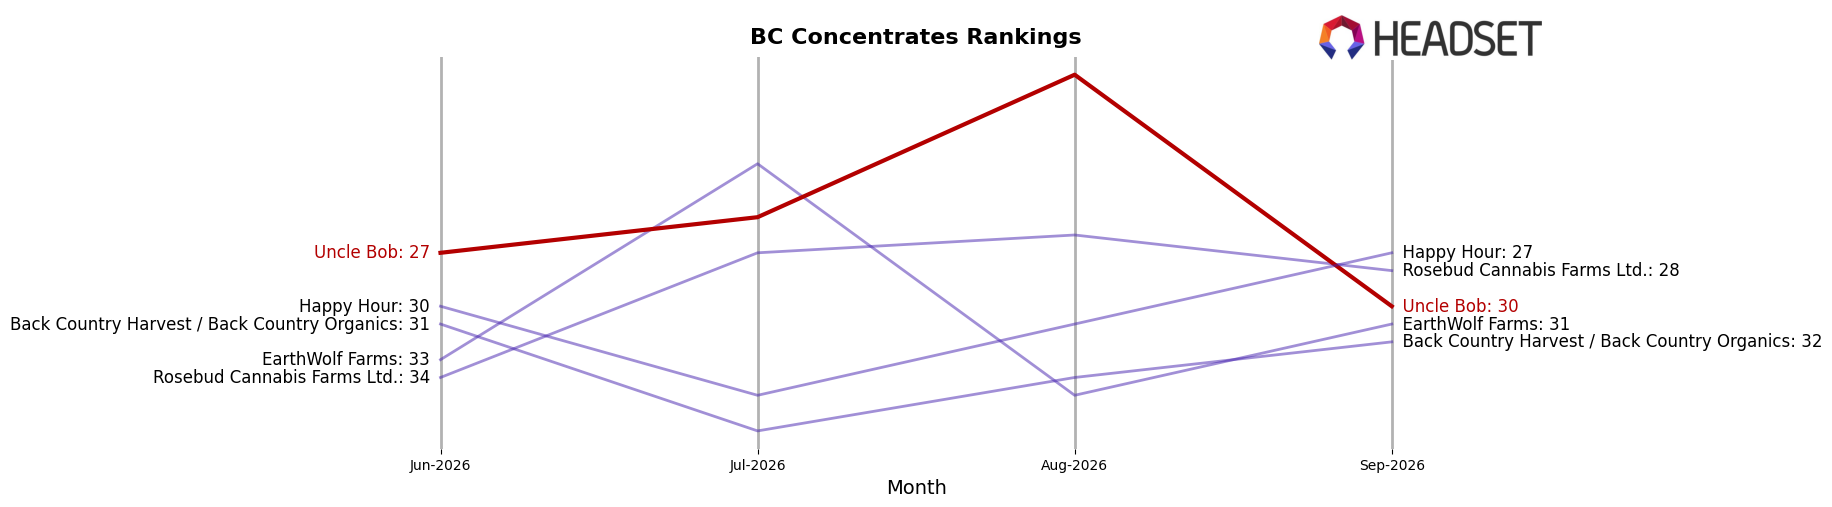
Uncle Bob sits at rank #30 in BC Concentrates in September 2026, down 1 position year over year from #29, and 3 spots below its June 2026 level of #27, while still far off its peak of #13 from September 2024; meanwhile, Endgame held #1 with a -13.2% YoY sales change and Dabble Extracts climbed from #15 to #3 on 242.3% YoY sales growth, indicating Uncle Bob’s flat-to-declining rank amid rising challengers and a softening leader points to share being redistributed upward to faster growers rather than consolidated at the top.
Notable Products
Orange Creamsicle THC Distillate Cartridge (1g) posted the steepest decline in September 2026 with a -78.7% MoM drop while sliding to rank 10, contrasting with Blueberry Kush THC Distillate Cartridge (1g) at rank 1 on a +6.5% MoM gain. Concentrates compressed sharply as Super Lemon Haze Shatter (1g) fell -61.6% at rank 4 and Indica Shatter (1g) dropped -49.7% at rank 2, pulling category mix away from dabbables and toward inhalable formats anchored by vapor pens. Four of the top ten are Concentrates, yet three of those sit at ranks 2, 4, and 7 with double-digit MoM declines of -49.7% to -61.6%, while Strawberry Punch Smalls (7g) in Flower slid -32.6% at rank 6, indicating value Flower is not backfilling the loss.
With the top spot held by a Vapor Pen and the deepest declines concentrated in Shatter SKUs, the pattern points to Uncle Bob pivoting commercially toward fewer, higher-velocity cartridge leaders rather than breadth in Concentrates, with near-term upside in reinforcing the winning cartridge while pruning underperforming dabbables; the $10,714 in September 2026 sales for Blueberry Kush THC Distillate Cartridge (1g) underscores where demand is consolidating.
Top Selling Cannabis Brands






Data for this report comes from real-time sales reporting by participating cannabis retailers via their point-of-sale systems, which are linked up with Headset’s business intelligence software. Headset’s data is very reliable, as it comes digitally direct from our partner retailers. However, the potential does exist for misreporting in the instance of duplicates, incorrectly classified products, inaccurate entry of products into point-of-sale systems, or even simple human error at the point of purchase. Thus, there is a slight margin of error to consider. Brands listed on this page are ranked in the top twenty within the market and product category by total retail sales volume.

