.svg)

Sep-2026
Sales
Trend
6-Month
Product Count
SKUs
Avg Price
YoY Sales Change
YoY Price Change


Market Insights Snapshot
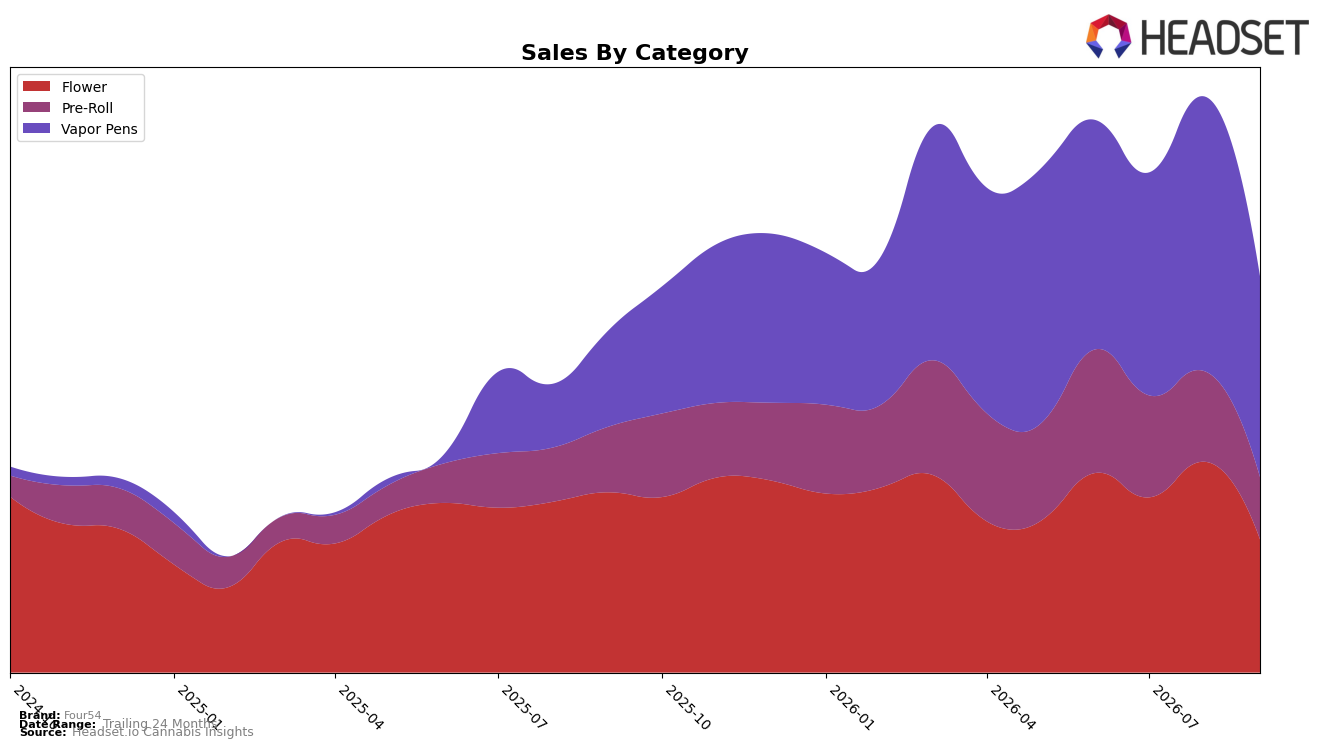
Four54’s category mix in September 2026 tilted toward Vapor Pens at 50.32% share, with year-over-year sales up 105.78% but month-over-month down 26.61%; Flower held 33.61% share with year-over-year down 25.68% and month-over-month down 36.31%; and Pre-Roll carried 16.07% share with year-over-year down 4.78% and month-over-month down 30.27%. Despite a 19.03% year-over-year increase in average price to $33.52 and brand-level sales up 15.54% year-over-year, the steep month-over-month contractions across all three categories signal that September 2026 was a demand reset rather than a pricing-led pullback; the pattern implies the brand’s category exposure amplified volatility, with Vapor Pens cushioning year-over-year gains while Flower and Pre-Roll dragged month-over-month momentum.
With Vapor Pens now the largest share driver at 50.32% and a category-specific year-over-year surge of 105.78% contrasted against a rank of 32 in Vapor Pens in Alberta, Four54 is positioned as a mid-pack player leaning into higher-priced formats, as indicated by the 19.03% increase in average price and a 33.61% concentration in Flower that is shrinking year-over-year by 25.68%. The juxtaposition of a 15.54% brand-level year-over-year sales lift alongside double-digit month-over-month drops across Vapor Pens (-26.61%) and Flower (-36.31%) implies that Four54’s short-term performance is tightly linked to seasonality and promotion cadence, while the long-term mix shift toward Vapor Pens sets the brand up to prioritize differentiated cartridges over volume-heavy Flower and Pre-Roll to stabilize share and improve rank efficiency.
Competitive Landscape
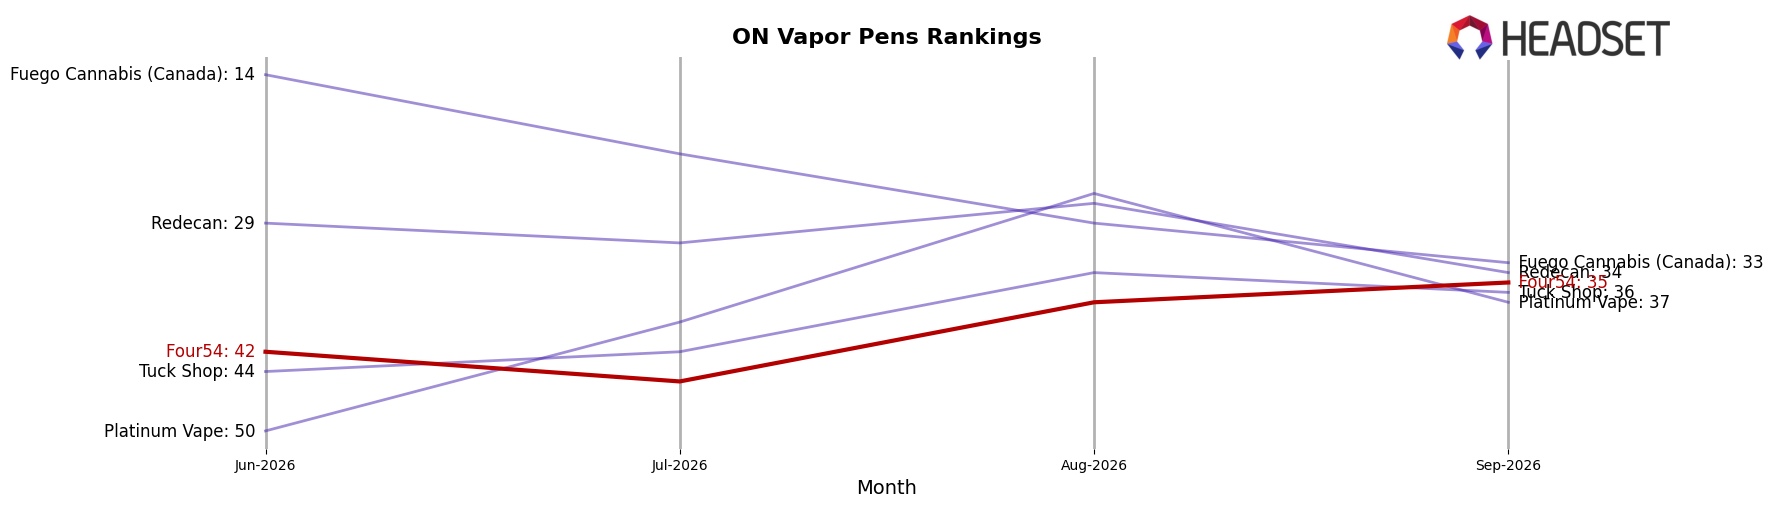
Four54 sits at rank #35 in ON Vapor Pens in September 2026, improving 47 positions year over year from #82 while rising 7 spots since June 2026 from #42; this is also its peak rank to date at #35 in September 2026, indicating a late-year step-up despite intense top-tier stability. Against this backdrop, Spinach climbed from #4 to #1 with 172.5% YoY sales growth, and General Admission slipped from #3 to #4 with an 12.0% YoY sales decline, signaling that the top of the table is both accelerating and reshuffling. The pattern implies Four54’s rank trajectory is catching a rising tide but still capped by leaders widening gaps, so sustaining share gains will require converting its September 2026 peak into consistent placement movement rather than a single-month crest.
Notable Products
Route 66 Infused Pre-Roll (0.6g) posted the steepest movement in September 2026 with a -56.1% month-over-month drop and slid to rank 7, indicating a sharp retreat in infused Pre-Rolls while Vapor Pens still hold ranks 1 and 2. Emerald Triangle Live Resin Cartridge (1g) stayed at rank 1 with a -5.7% decline as Gastro Pop Live Resin Cartridge (1g) fell -48.1% at rank 2, and three Vapor Pen SKUs still occupy two of the top five spots, signaling consolidation at the top around inhalable formats. Cherry Bang Bang (3.5g) fell -24.7% at rank 3 while Route 66 (3.5g) declined -27.5% at rank 10, and four of the top ten are Flower SKUs, implying Flower depth is broad but momentum is tilting away from value ounces toward curated eighths. The pattern points to Four54 leaning into cartridge-led demand while de-emphasizing infused Pre-Rolls, suggesting near-term mix optimization around fewer, higher-velocity Vapor Pens despite a diversified Flower bench.
Top Selling Cannabis Brands






Data for this report comes from real-time sales reporting by participating cannabis retailers via their point-of-sale systems, which are linked up with Headset’s business intelligence software. Headset’s data is very reliable, as it comes digitally direct from our partner retailers. However, the potential does exist for misreporting in the instance of duplicates, incorrectly classified products, inaccurate entry of products into point-of-sale systems, or even simple human error at the point of purchase. Thus, there is a slight margin of error to consider. Brands listed on this page are ranked in the top twenty within the market and product category by total retail sales volume.

