Market Insights Snapshot
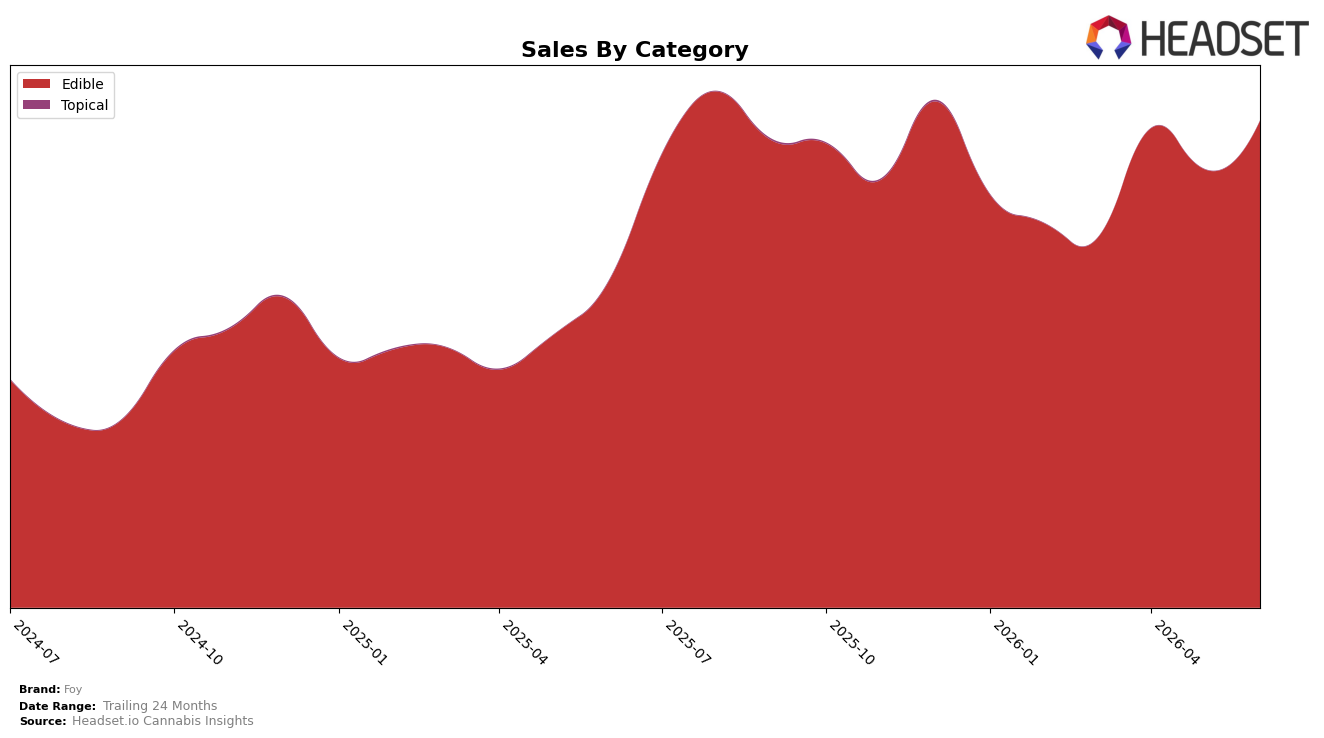
In June 2026, Foy operated as a single-category brand with Edible at 100.0% category share, pairing 49.69% year-over-year growth with 11.08% month-over-month expansion, while the brand-level sales increased 49.43% YoY and average price rose 1.50% YoY. Within New York Edibles, the brand held rank 15, implying scale gains are occurring without multi-category dilution and that price stability around $24.97 is supporting unit growth more than ticket size.
The consolidation in Edibles at 100.0% share alongside a mid-pack rank of 15 and double-digit 11.08% MoM momentum indicates Foy is skewing toward velocity plays rather than breadth, with June 2026 performance driven by penetration and repeat rather than premiumization. The 49.69% YoY surge in the Edible line, outpacing the modest 1.50% YoY price lift, implies volume-led gains that can lift rank from 15 if sustained, but the single-category posture also concentrates risk and suggests the brand’s positioning is anchored to Edible-specific demand cycles in New York.
Competitive Landscape
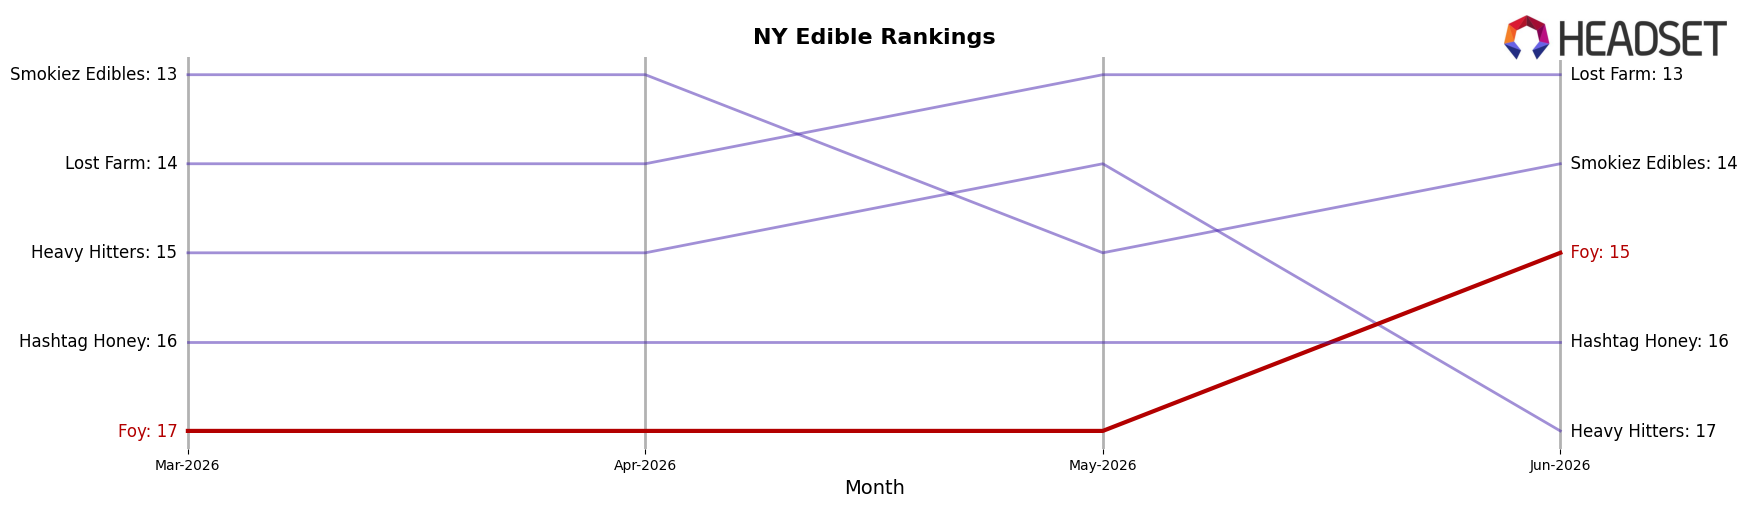
Foy is currently ranked #15 in NY Edible, improving 1 rank position from #16 year over year and 2 positions from #17 three months ago, while still trailing its historical peak of #12 set in June 2024; by contrast, Off Hours slipped from #1 to #2 as Wyld held steady at #3 with a 26.0% year-over-year sales lift, indicating that Foy’s marginal rank gains amid top-tier stability suggest incremental presence rather than breakout momentum.
Notable Products
CBD/THC/CBC 1:1:1 Daytime Mango Blood Orange Chews 4-Pack (50mg CBD, 50mg THC, 50mg CBC) posted a +263% month-over-month surge in June 2026 while sitting at rank 6, contrasting with CBD/THC/CBN 1:1:1 Night Time Sleep Strawberry Chews 4-Pack (20mg THC, 20mg CBD, 20mg CBN) dropping -34% at rank 5. The top two positions are held by 20-Pack formats—CBD/THC/CBN 1:1:1 Night Time Strawberry Adaptogen Chews 20-Pack (100mg THC, 100mg CBD, 100mg CBN) at rank 1 with +5.9% MoM and CBD/THC/CBG 1:1:1 Daytime Mango Blood Orange Chews 20-Pack (100mg CBD, 100mg THC, 100mg CBG) at rank 2 with +11.2%—indicating larger-count packs are consolidating share over 4-Packs that fell -18% to rank 4. Four of the top seven are multifunction 1:1:1 cannabinoid Edibles, and Strawberry Gummy 20-Pack (100mg) slid -41% at rank 7 despite the category skew, implying flavor and functional positioning matter more than base gummy format. The pattern suggests Foy’s product mix is tilting toward higher-count, function-led 1:1:1 Edibles, signaling a strategy to prioritize bundle value and clear day/night use-cases over smaller trial sizes.
Top Selling Cannabis Brands
Data for this report comes from real-time sales reporting by participating cannabis retailers via their point-of-sale systems, which are linked up with Headset’s business intelligence software. Headset’s data is very reliable, as it comes digitally direct from our partner retailers. However, the potential does exist for misreporting in the instance of duplicates, incorrectly classified products, inaccurate entry of products into point-of-sale systems, or even simple human error at the point of purchase. Thus, there is a slight margin of error to consider. Brands listed on this page are ranked in the top twenty within the market and product category by total retail sales volume.

