.svg)

Aug-2026
Sales
Trend
6-Month
Product Count
SKUs
Avg Price
YoY Sales Change
YoY Price Change


Where to Buy
Hashtag Honey is stocked at 181 licensed dispensaries across New York, with the deepest coverage in New York, Brooklyn, Queens, The Bronx, and Syracuse. Search by ZIP code or city below to find the closest one, or filter by product type if you are after a specific format.
Market Insights Snapshot
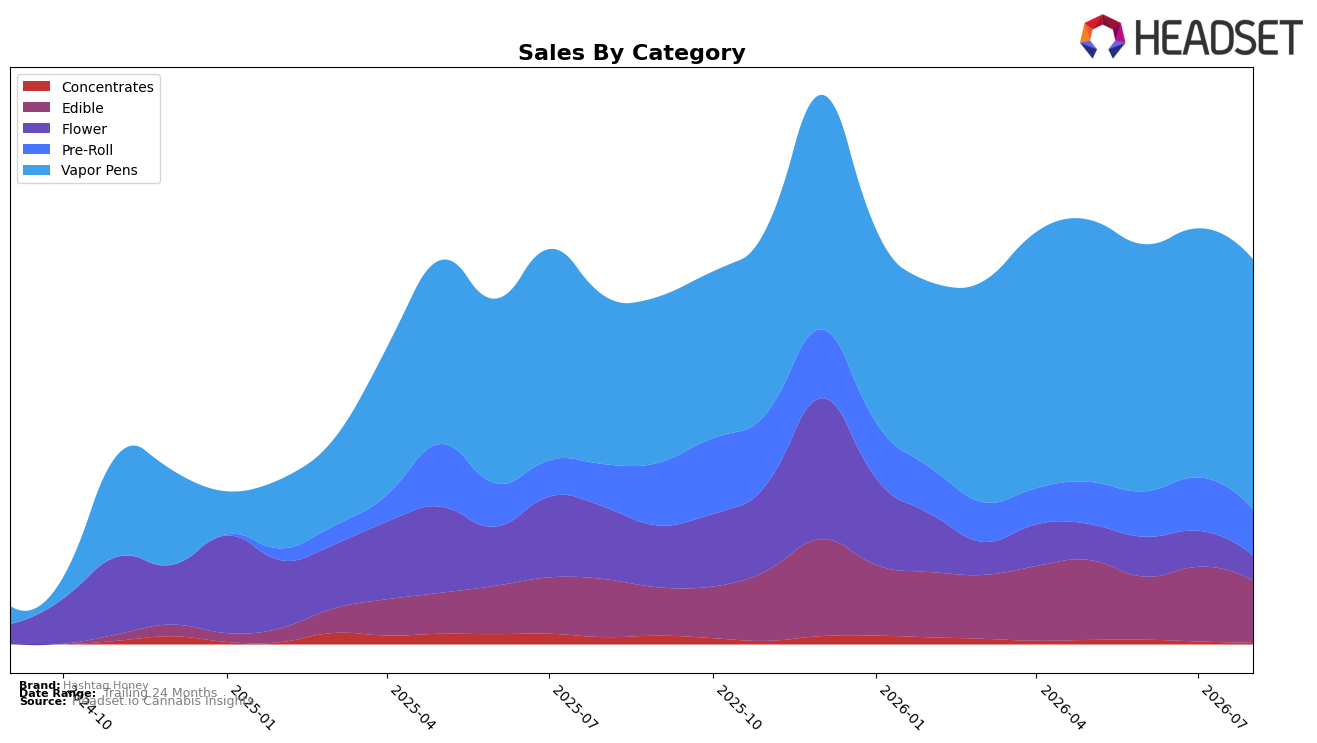
In August 2026, Hashtag Honey concentrated 65.09% of sales in Vapor Pens with a 48.50% year-over-year uptick and a 0.31% month-over-month gain, while Edible held 16.02% share with 6.46% YoY growth but a 17.30% MoM decline. Pre-Roll accounted for 11.96% share with 7.92% YoY growth and a 13.63% MoM drop, whereas Flower fell to 6.53% share with a 65.16% YoY contraction and a 29.83% MoM slide; Concentrates were 0.39% share with a 79.28% YoY drop and a 47.77% MoM decline. Average price across the brand decreased 19.18% YoY to $23.19, while Vapor Pens averaged $36.28 and Flower averaged $39.11, indicating mix-driven pricing pressure concentrated away from high-price but shrinking Flower. The data implies Hashtag Honey’s current momentum hinges on Vapor Pens stability and modest MoM growth offsetting double-digit MoM contractions in Edible and Pre-Roll, making category concentration both the growth engine and the exposure point.
The mix shift toward Vapor Pens alongside a -65.16% YoY collapse in Flower and a combined -30.93 percentage-point MoM contraction across Edible (-17.30%) and Pre-Roll (-13.63%) signals a positioning anchored in inhalable convenience rather than traditional Flower or niche Concentrates (-79.28% YoY). With Vapor Pens ranked 9th in New York and holding a 65.09% internal share, a 0.31% MoM gain there can compound even modest share improvements, whereas further erosion in low-share Concentrates (0.39%) offers negligible downside buffer. The implication is a need to defend Vapor Pens velocity while selectively stabilizing Edible or Pre-Roll to diversify risk without diluting the core, because the 19.18% YoY price decline suggests the brand is trading mix and accessibility for scale in a category where small rank movements near 9 can unlock disproportionate reach.
Competitive Landscape
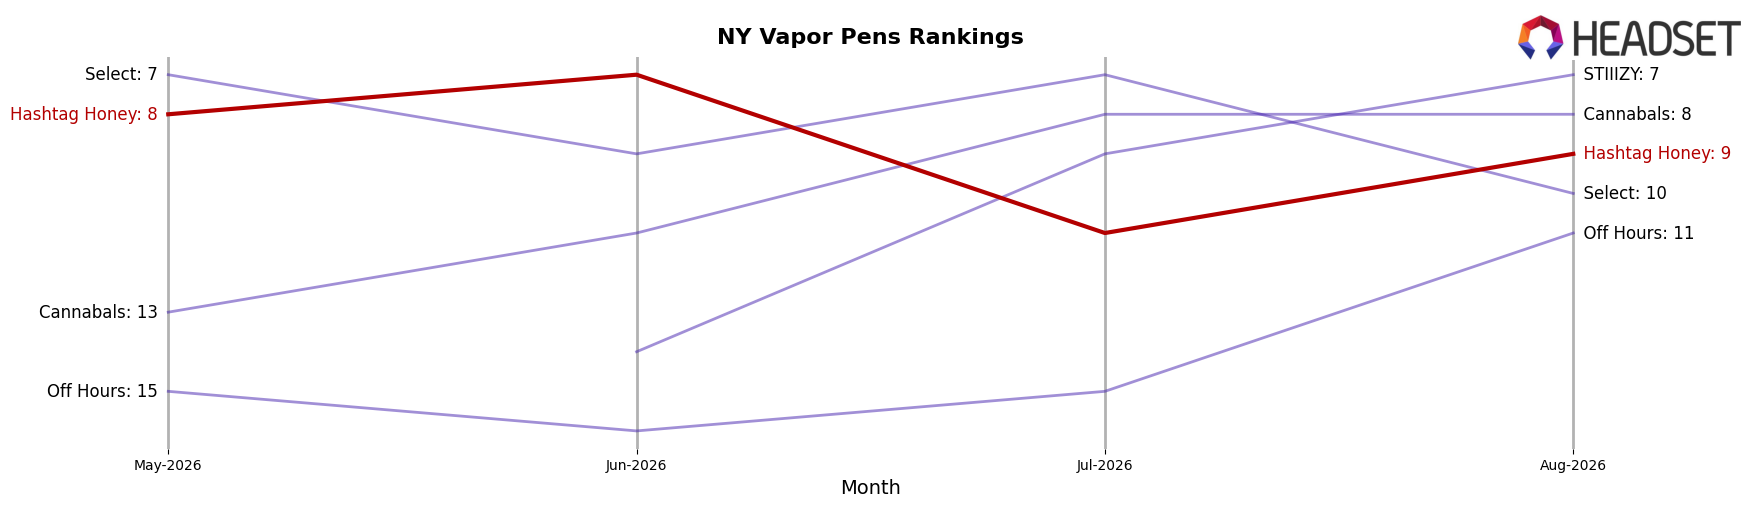
Hashtag Honey is ranked #9 in NY Vapor Pens in August 2026, improving 4 positions year over year from #13 while slipping 1 rank from May–June’s #8 to the current #9; versus peers, Fernway moved from #3 to #1 alongside a 35.5% sales increase and Jetty Extracts surged from #26 to #5 with a 228.2% lift, indicating share is consolidating among climbers while Jaunty fell from #1 to #2 amid a 24.3% decline; Hashtag Honey’s peak of #7 in June 2026 followed by a 2-rank drop into August 2026 suggests a mid-pack ascent stalled as faster-rising entrants compressed the middle ranks.
Notable Products
Strawberry Cough Pre-Roll (1g) posted the steepest month-over-month decline at -40.4% and slid to rank 6, while Maui Wowie Pre-Roll (1g) also contracted -15.5% but held rank 1, indicating share consolidation at the top despite volatility lower in the lineup. Green Crack Pre-Roll (1g) rose 27.1% to rank 2, yet no SKU cleared a +50% gain, and Cali Melon Live Resin Gummies 10-Pack (100mg) dipped -5.3% at rank 10, signaling mixed momentum across formats. Four of the top ten are Edible SKUs clustered between ranks 4 and 10, with Blue Razz Live Resin Gummies 10-Pack (100mg) essentially flat at +0.6% and Black Cherry Live Resin Gummies 10-Pack (100mg) up 14.4%, implying the non-inhalable mix is steadying overall revenue around $39,000 per leading gummy while inhalables swing more sharply. The pattern implies Hashtag Honey is leaning into a two-speed portfolio where Pre-Rolls drive rank visibility but Edibles provide consistency, suggesting resource allocation should favor stabilizing Pre-Rolls while scaling Edible breadth for dependable month-to-month volume.
Top Selling Cannabis Brands






Data for this report comes from real-time sales reporting by participating cannabis retailers via their point-of-sale systems, which are linked up with Headset’s business intelligence software. Headset’s data is very reliable, as it comes digitally direct from our partner retailers. However, the potential does exist for misreporting in the instance of duplicates, incorrectly classified products, inaccurate entry of products into point-of-sale systems, or even simple human error at the point of purchase. Thus, there is a slight margin of error to consider. Brands listed on this page are ranked in the top twenty within the market and product category by total retail sales volume.

