.svg)


Where to Buy
Frozen is stocked at 25 licensed dispensaries across Michigan, with the deepest coverage in New Buffalo, Benton Harbor, Sturgis, Ypsilanti, and Ann Arbor. Search by ZIP code or city below to find the closest one, or filter by product type if you are after a specific format.
Market Insights Snapshot

Frozen concentrated its August 2026 mix in Pre-Roll at 95.00% share, up alongside a 141.34% year-over-year gain and a 98.98% month-over-month jump, while Concentrates held 4.88% share with 135.39% YoY and 26.12% MoM growth. Edible shrank to 0.12% share with a -95.21% YoY decline but spiked 522.54% MoM off a minimal base, and the brand’s overall average price fell 6.84% YoY to $2.08 even as total brand sales rose 127.71% YoY. With a Michigan Pre-Roll rank of 47, the data indicate a scale-through-volume posture in Pre-Roll, with Concentrates as a secondary growth vector and Edible functioning as a tactical, low-weight test rather than a material revenue pillar.
The mix shift implies Frozen is prioritizing share capture in value-priced Pre-Roll (average price $2.00 in category versus brand average down 6.84% YoY) to drive rapid unit throughput, evidenced by the 98.98% MoM surge coinciding with a 141.34% YoY climb and anchored by a 95.00% category share. Concentrates’ 26.12% MoM and 135.39% YoY gains at a higher $8.01 average price position it as a margin stabilizer, while Edible’s -95.21% YoY and 0.12% share despite a 522.54% MoM rebound suggest limited strategic exposure; together with rank 47 in Michigan Pre-Roll, the pattern implies a penetration-led strategy that trades price for velocity to improve ranking before broadening premium offerings.
Competitive Landscape
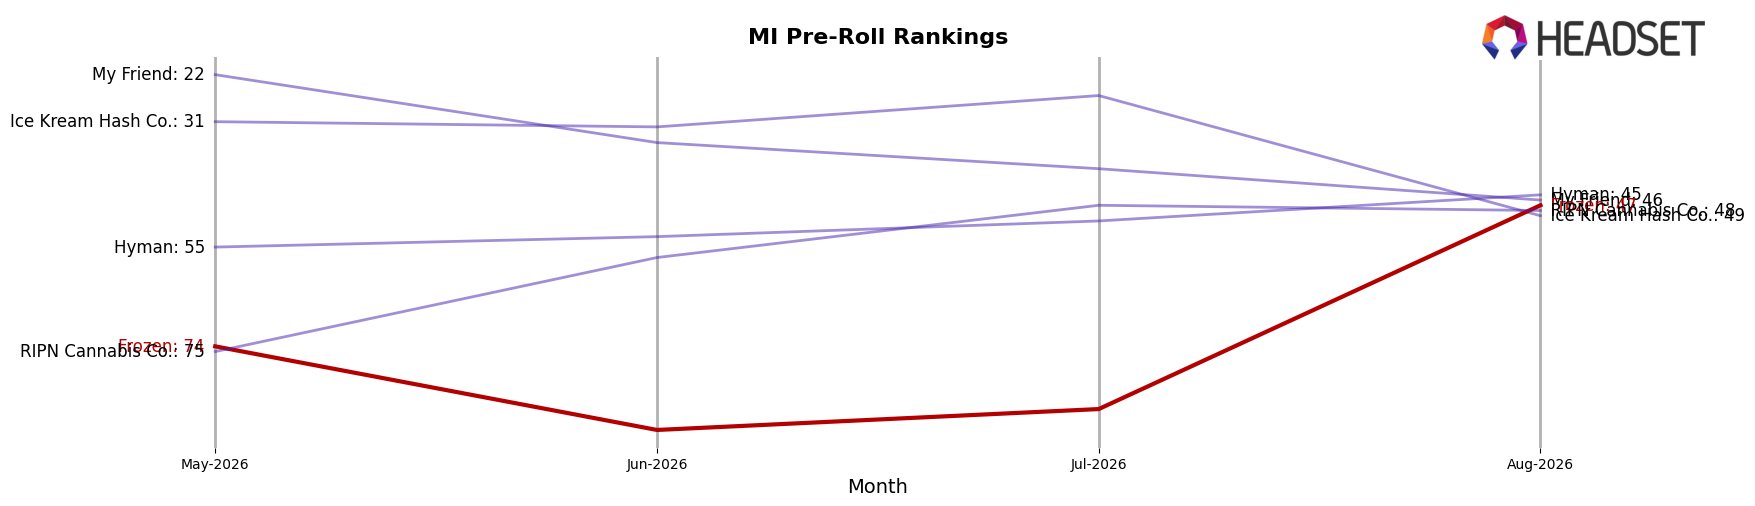
Frozen sits at rank 47 in MI Pre-Roll in August 2026, an improvement of 67 positions YoY from rank 114, and a 27-place climb from rank 74 three months prior; hitting a peak rank of 47 in August 2026 pairs with a year-over-year leap that outpaced Pro Gro, which moved up 5 spots from rank 9 to rank 4, while Goodlyfe Farms slid 1 position from rank 4 to rank 5 amid a 41.1% sales decline. Against top-tier stability—Jeeter held rank 1 YoY with 3.1% sales growth and Cali-Blaze stayed at rank 2 despite a 40.4% sales contraction—Frozen’s 67-rank YoY rise and 27-rank quarterly gain indicate momentum driven by distribution gains rather than share capture at the category summit, implying a trajectory toward mid-tier consolidation rather than immediate top-10 contention.
Notable Products
War Headz Pre-Roll (1g) posted the standout move with a 279% month-over-month gain to rank 3 in August 2026, outpacing Permanent Marker Pre-Roll (1g) at rank 2 with a 225% lift and exceeding Nutcrackerz Pre-Roll (1g) at rank 6 with a 100% increase. Sex Tape Pre-Roll (1g) held rank 1 with a 22% MoM rise, while Sherb Cake Pre-Roll (1g) climbed to rank 7 on a 165% surge, and eight of the top ten are Pre-Roll SKUs, concentrating the portfolio around a single form factor. With only one raw dollar figure visible at the top spot near $29,684 and rapid gains clustered in ranks 2–7 above +100%, the mix implies Frozen is leaning into velocity-driven Pre-Rolls where momentum can quickly translate into share capture.
Top Selling Cannabis Brands






Data for this report comes from real-time sales reporting by participating cannabis retailers via their point-of-sale systems, which are linked up with Headset’s business intelligence software. Headset’s data is very reliable, as it comes digitally direct from our partner retailers. However, the potential does exist for misreporting in the instance of duplicates, incorrectly classified products, inaccurate entry of products into point-of-sale systems, or even simple human error at the point of purchase. Thus, there is a slight margin of error to consider. Brands listed on this page are ranked in the top twenty within the market and product category by total retail sales volume.

